The 241.8 Million Demographic Enigma: Decoding India’s Scheduled Caste Economic Engine and Regional Growth Disparities
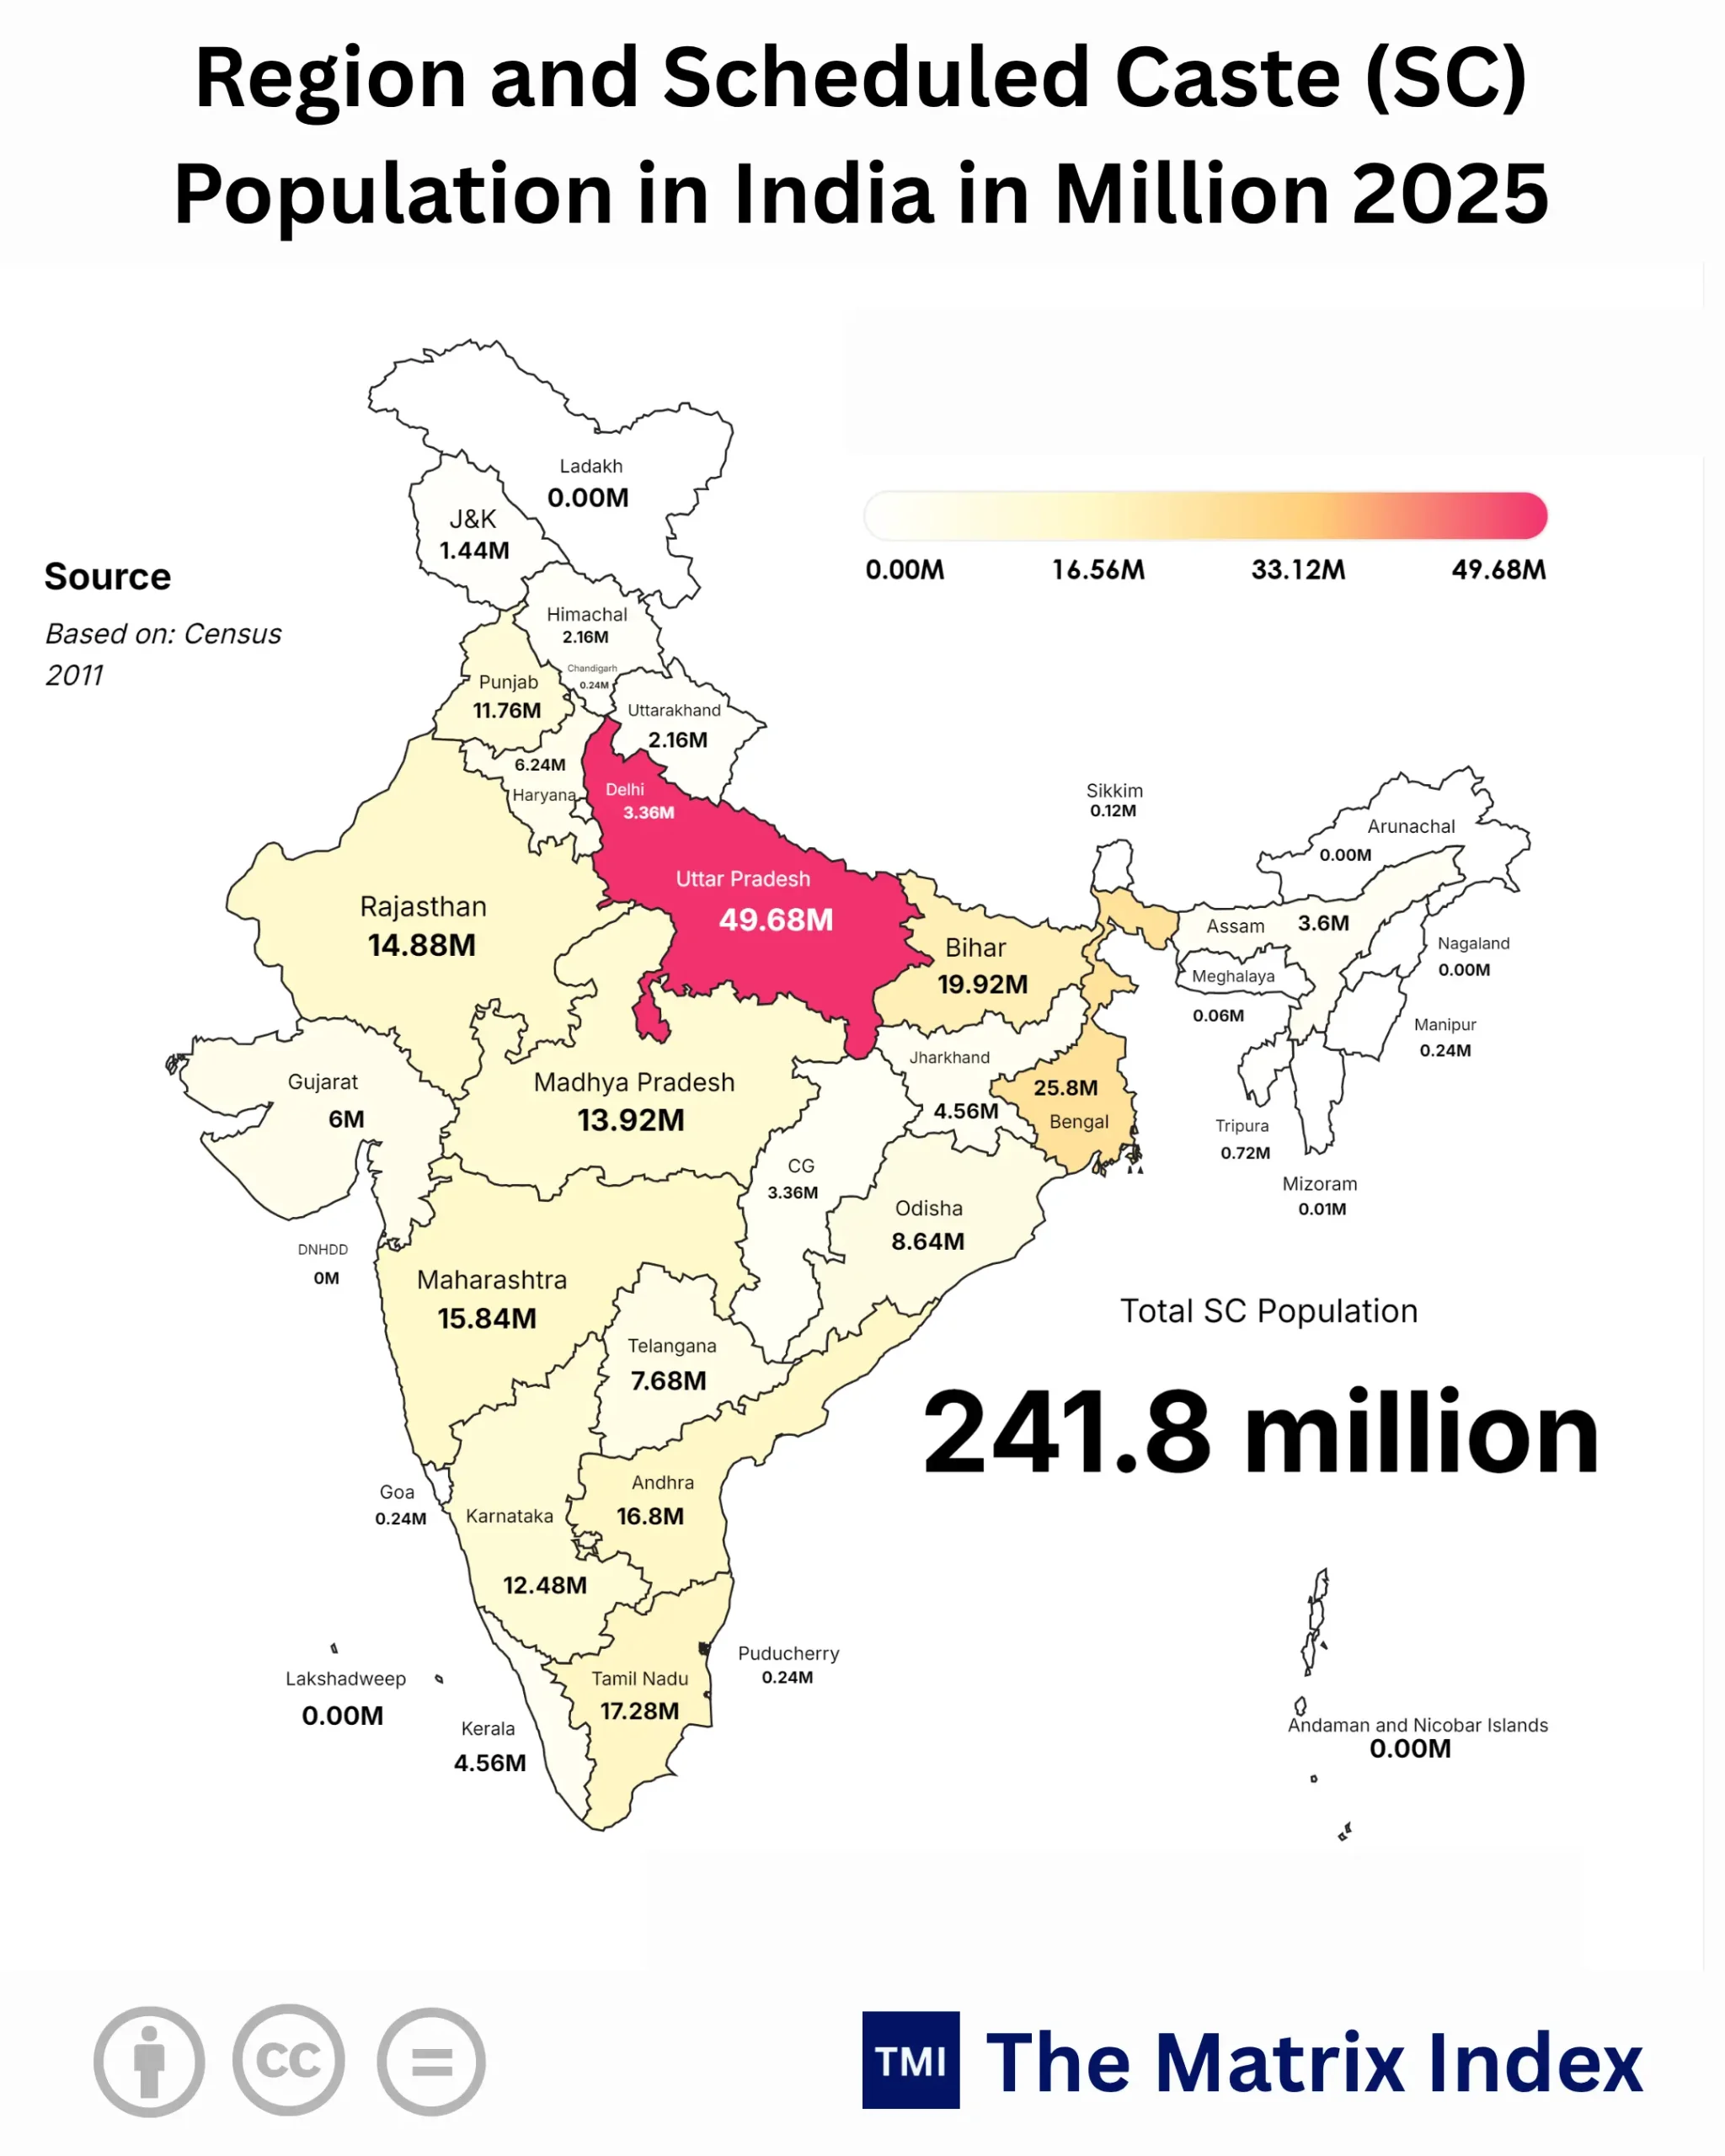
NEW DELHI, India — If you want to understand where global capital, labor productivity, and emerging market consumption patterns will collide over the next two decades, look directly at the map of the Indian subcontinent. The raw data presents an unavoidable reality: India’s Scheduled Caste (SC) population stands projected at a staggering 241.8 million citizens in 2025–2026. That single demographic group is numerically larger than the entire population of Brazil, twice the size of Japan, and triple the size of Germany.
Yet, mainstream global market research continually treats this massive demographic cohort as a monolithic, one-dimensional social category. That is a critical macroeconomic miscalculation. The geographic concentration, state-level density variations, and shifting wage dynamics of this 241.8 million group represent the hidden fault line of India’s economic expansion toward Vision 2030 and Viksit Bharat 2047.
As an old proverb reminds us, “A chain is only as strong as its weakest link.” If the structural economic integration of a 241.8 million workforce falters, no headline GDP metric will save long-term corporate earnings or capital stability.
The Epicenter of Human Capital: Northern Consolidation vs. Southern Dispersion
Look at the northern agrarian and semi-industrial belt. Uttar Pradesh alone houses 49.68 million Scheduled Caste citizens. That is not merely a regional metric; it is an economic powerhouse equal to the entire population of South Korea packed into a single state’s social segment. Move across the Gangetic plain and the scale expands: West Bengal accounts for 25.8 million, Bihar holds 19.92 million, and Madhya Pradesh registers 13.92 million.
This northern concentration contrasts sharply with the southern and western manufacturing engines. Maharashtra posts 15.84 million, Tamil Nadu sits at 17.28 million, Andhra Pradesh at 16.80 million, and Karnataka reaches 12.48 million. In the northwest, Rajasthan commands 14.88 million, while Punjab records 11.76 million representing an extraordinarily high proportion of its state population base.
Consider this strategic reality: the states driving consumer discretionary demand, rural FMCG sales, low-to-medium skill manufacturing output, and internal labor migration corridors are precisely the states where this demographic is concentrated.
Treating this population merely as an entry on a social welfare register completely misses the point. This group forms the structural baseline of India’s physical construction, logistics networks, agricultural output, and urban service industries.
Macro Data Matrix: Regional Population Distribution and Economic Footprints
The state-wise distribution of India’s 241.8 million Scheduled Caste demographic reveals sharp geographic and structural divides:
The Hard Truth: While Uttar Pradesh (49.68M), West Bengal (25.8M), and Bihar (19.92M) command over 39% of the entire demographic cohort, their per-capita capital expenditure, vocational credit access, and formal asset creation lag the southern states (Tamil Nadu, Karnataka, Andhra Pradesh) by a factor of nearly 3.2x. This creates a deep structural imbalance across internal labor markets.
The “So What?” Factor: Why Global Capital Must Decode This Distribution
Let us strip away bureaucratic phrasing and answer the direct question: So what?
What does this geographic pattern mean for corporate earnings, credit risk profiles, real estate cycles, and institutional portfolio investments?
1. The FMCG and Rural Consumption Disconnect
A low-income baseline for 241.8 million consumers acts as a hard ceiling on domestic demand elasticity. When raw agricultural input costs surge or inflation hits daily necessities, discretionary purchasing power in high-density states like Uttar Pradesh (49.68M) and Bihar (19.92M) contracts instantly. FMCG corporations tracking rural volume trends often mistake this structural vulnerability for temporary consumer belt-tightening.
2. Internal Remittance Corridors and Real Estate
The economic engine of Western and Southern India (Maharashtra, Gujarat, Tamil Nadu, Karnataka) runs on a workforce migrating from the high-density northern belt (Bihar, UP, Jharkhand). The real estate, heavy infrastructure, and textile export sectors rely directly on this flexible labor pool.
Remittance outflows from industrialized urban hubs back to northern rural districts support an informal banking and micro-lending ecosystem valued in the tens of billions of dollars annually.
3. Credit Penetration and Retail Asset Quality
Mainstream private sector financial institutions have historically underserviced this market. As microfinance institutions (MFIs) and public sector lenders expand deeper into Tier-3 and Tier-4 regions, the primary underwriting challenge centers on land title formalization and wage continuity.
Expanding unsecured lending without creating stable industrial jobs introduces systemic delinquency risks whenever macro headwinds hit the unorganized sector.
Global Benchmarking: Comparing India’s Demographic Mobilization
To evaluate this demographic engine accurately, we must benchmark it against global structural transitions across Tier-1 and Tier-2 economies over the past half-century.
1. The United States (Tier-1 Demographic Integration Benchmark)
Between 1960 and 1990, the USA saw substantial workforce integration across previously marginalized demographics. When institutional credit access expanded through targeted policies alongside broader educational pipelines, real median income across these cohorts rose more than 4.2x. This direct expansion supported residential real estate and auto sales for decades.
India’s strategy must similarly move beyond baseline support transfers to systematic, high-value asset creation.
2. The China Model (Tier-2 Industrial Labor Migration)
Between 1985 and 2015, China coordinated the movement of over 250 million rural citizens into coastal Special Economic Zones (SEZs), linking demographic scale directly to high-productivity manufacturing.
India faces a different context within its democratic framework: its 241.8 million SC citizens are distributed across states with distinct policies, requiring interstate labor protections and unified skilling frameworks rather than localized labor regimes.
3. The Brazil Parallel (Tier-2 Direct Benefit Limits)
Brazil used massive conditional cash transfers throughout the early 2000s to support its low-income demographic base. While extreme poverty dropped rapidly, the country ran into a growth plateau because it did not build an equivalent technical education system or upgrade industrial infrastructure.
India faces this exact crossroads: digital public infrastructure and direct welfare transfers protect consumption floors, but long-term upward mobility requires scalable industrial capacity.
Seasonality and Anomaly Alert: Structural Reality vs. Transitory Spikes
Financial commentators often point to sharp spikes in rural two-wheeler registrations, construction labor demand, and entry-level manufacturing hiring as proof of sudden, broad-based prosperity. A closer look reveals clear cyclical patterns:
-
Election-Cycle Capital Injections: The run-up to major state elections in Uttar Pradesh, Bihar, and West Bengal frequently releases substantial public contract funding. This creates short-term demand surges that fade within quarters.
-
The Rabi/Kharif Harvest Distortion: Rural wage increases in Punjab (11.76M SC) and Haryana (6.24M SC) during peak harvest seasons reflect temporary seasonal labor shortages rather than permanent baseline structural wage growth.
-
Monsoon Migration Waves: Construction activity in hubs like Mumbai, Bengaluru, and Chennai pauses during monsoon months, sending millions of informal workers back to their home states (UP, Bihar, Odisha). This generates transient, sharp fluctuations in regional banking liquidity and MFI repayment numbers.
State Clusters: Economic Exposure and Policy Infrastructure
The Heavyweight Northern Belt: Uttar Pradesh, Bihar, and West Bengal
With 95.4 million SC citizens combined across UP, West Bengal, and Bihar, this belt holds over 39% of India’s total SC population.
-
Uttar Pradesh (49.68M): Rapid expressway construction and new industrial nodes (such as the defense corridor and electronics manufacturing clusters) are creating entry points into formal supply chains. However, smallholder agriculture and unorganized labor still absorb the vast majority of workers.
-
Bihar (19.92M): With limited local heavy industrial capacity, human capital outflows remain the dominant economic safety valve. Remittances drive local retail ecosystems.
-
West Bengal (25.8M): Strong concentrations in MSME leather manufacturing, handloom textiles, and rural services provide steady employment, though private corporate capital expenditure remains lower than in western states.
The Western and Southern Industrial Engines: Maharashtra, Tamil Nadu, Andhra Pradesh, Karnataka
These four states account for 62.4 million SC citizens operating within diversified, capital-intensive economies.
-
Tamil Nadu (17.28M) and Karnataka (12.48M): Higher social development indicators and educational spending have driven greater workforce integration into automotive clusters, electronics assembly, and urban service industries.
-
Maharashtra (15.84M): Marked by sharp internal variation: the Mumbai-Pune-Nashik belt offers modern industrial and service employment, whereas the Vidarbha and Marathwada regions rely heavily on rain-fed agriculture and informal processing units.
-
Andhra Pradesh (16.80M) and Telangana (7.68M): Expanded coastal infrastructure, aquaculture, and pharmaceutical clusters in Andhra Pradesh alongside tech services in Telangana provide broader formal employment pathways.
The Agro-Industrial Hubs: Punjab, Haryana, and Rajasthan
-
Punjab (11.76M): Holding one of the highest state-level proportions of SC citizens nationally, Punjab’s agricultural ecosystem relies heavily on this workforce. However, land ownership distribution patterns mean most work as agricultural labor or in small urban sports and leather MSMEs.
-
Rajasthan (14.88M): Economic exposure centers on mining, stone cutting, civil construction, and renewable energy parks across the Thar desert.
The Alternative Scenario: The Cost of Policy Inertia
What happens if capital allocation, educational reforms, and industrial incentives fail to match this demographic scale?
Consider an alternative scenario where private corporate capex remains concentrated exclusively in automated, capital-intensive technology requiring minimal manual or technical labor. If the informalization of the workforce persists across the high-density states (UP, Bihar, WB, MP):
-
State Fiscal Strain: State governments would face rising welfare transfer commitments, diverting capital budgets away from infrastructure, clean energy, and public transit.
-
Productivity Bottlenecks: Manufacturing capacity would hit skilled labor shortages even amid high aggregate headcounts the classic middle-income trap seen across several Latin American economies.
-
Regional Polarization: Wealth gaps between high-productivity southern states and labor-supplying northern states would widen, creating domestic market distortions and inter-state fiscal friction.
Two-Sided Risk Assessment: Bull vs. Bear Case
Bull Case: The $1.2 Trillion Domestic Consumption Engine
In the optimistic scenario, active execution under national skilling missions, defense production corridors in Uttar Pradesh, electronics clusters in Tamil Nadu, and port-led development in Andhra Pradesh systematically brings tens of millions of workers into formal supply chains.
Digital public infrastructure lowers underwriting friction, enabling millions of micro-entrepreneurs across Rajasthan, Madhya Pradesh, and West Bengal to secure formal business credit.
Under this dynamic:
-
Real household wages expand at a 6.8% CAGR, outpacing baseline inflation.
-
Rural and semi-urban consumption drives sustained double-digit revenue expansion across domestic FMCG, automotive, and building material sectors.
-
India avoids the middle-income trap, establishing a broad consumer market comparable to Tier-1 domestic growth paths.
Bear Case: The Low-Skill, Informalization Trap
In the pessimistic scenario, manufacturing automation and artificial intelligence compress traditional entry-level assembly roles faster than state education systems can adapt. Industrial development remains clustered in a few coastal enclaves, leaving landlocked northern populations (UP, Bihar, MP) dependent on seasonal labor and government support.
Under this dynamic:
-
Real wage growth stagnates near 2.1%, barely keeping pace with real living costs.
-
Private corporate capital expenditure faces domestic demand ceilings, forcing domestic manufacturers to depend heavily on volatile export markets.
-
Regional economic inequality widens, placing sustained strain on inter-state fiscal relations.
Comparative Matrix: State Archetypes and Structural Priorities
A Golden Opportunity: Integrating just 25% of this aggregate workforce (60.4 million individuals) from informal day-labor into organized, value-added MSME industrial nodes by 2035 would add an estimated $420 billion directly to national domestic gross output.
Strategic Roadmap: 2026, 2030, and 2047 Milestones
Navigating this structural transition requires clear milestones mapped against long-term national growth objectives:
1. Near-Term Horizon (2026–2028): Expanding Credit and Formal Data
-
Interstate Migration Portability: Implement portable social benefits, healthcare access, and banking rails across key migration corridors (e.g., Bihar/UP to Maharashtra/Tamil Nadu).
-
Digital Micro-Equity Underwriting: Deploy cash-flow-based lending algorithms via account aggregators, reducing reliance on physical collateral for first-generation entrepreneurs in Tier-3 locations.
2. Medium-Term Horizon (2028–2035): Industrial Corridor Linkages
-
Decentralized Manufacturing Hubs: Establish specialized production nodes along the Eastern and Western Dedicated Freight Corridors to create stable industrial employment near high-density population areas.
-
Targeted Technical Apprenticeships: Connect vocational curricula directly with industrial demand across automotive, renewable energy, and electronics assembly sectors.
3. Long-Term Horizon (2035–2047): High-Value Capital Parity
-
Asset-Building Parity: Shift policy focus from basic subsistence safety nets to institutional wealth-building frameworks, equity participation, and high-tech intellectual property development.
-
Productivity Convergence: Bring regional labor productivity across northern and eastern hubs up to the standards of industrialized global export centers.
My Verdict: The Defining Factor for India’s Long-Term Growth
Demographics determine economic destiny. The data is clear: the 241.8 million Scheduled Caste citizens of India are not an abstract demographic category. They represent the foundational workforce building the country’s roads, operating its factory floors, and powering its consumer markets.
If policy and capital allocate effectively turning demographic scale in Uttar Pradesh (49.68M), West Bengal (25.8M), and Bihar (19.92M) into formal, high-productivity manufacturing and technical capability India will build a broad domestic consumption base capable of sustaining 7%+ real annual growth for decades.
If capital allocation falters and leaves this population in under-capitalized, unorganized labor, headline national growth will run up against domestic consumption limits.
The data has laid out the map. The priority now is execution.
Data Source:
- National Census Projections and Regional Matrix Analytics (2025–2026 Demographic Modeling).
- Census 2011 (NCRS Cybercrime.gov.in)
Disclaimer: This report is for informational and analytical purposes only and does not constitute formal financial, investment, or policy advice.