The 6% Illusion: Inside India’s Great Public Sector Mirage and the Regional Divide Shaping 650 Million Workers
NEW DELHI, India — Look across the crowded coaching hubs of Mukherjee Nagar in Delhi or the study halls of Prayagraj, and you will see millions of bright-eyed youth sacrificing their prime years for a dream that mathematically does not exist. The national conversation is constantly dominated by government vacancies, recruitment drives, and state pension schemes. Yet, beneath the political rhetoric lies a brutal economic reality: only 6.0% of India’s 650 million workforce a modest 39 million individuals actually draws a paycheck from the state.
Ninety-four out of every hundred working Indians operate entirely in the private, agrarian, or unorganized wilderness. They face daily wage volatility, zero social safety nets, and no institutional healthcare.
How did the world’s most populous democracy build an economic architecture where an overwhelming majority competes relentlessly for an asset controlled by just 6%?
The regional distribution of these 39 million jobs reveals sharp structural divides across Indian economic geography. It is an economic landscape defined by geography, historical industrial policy, and stark state-level fiscal disparities.
The Great Continental Divide: Absolute Volume vs. Demographic Density
When analyzing public employment in India, raw headcounts conceal underlying structural dynamics. The data demands that we look at two distinct lenses: the Percentage Share of State Workforce (the density of state dependency) and the Absolute Workforce Headcount (the raw fiscal weight).
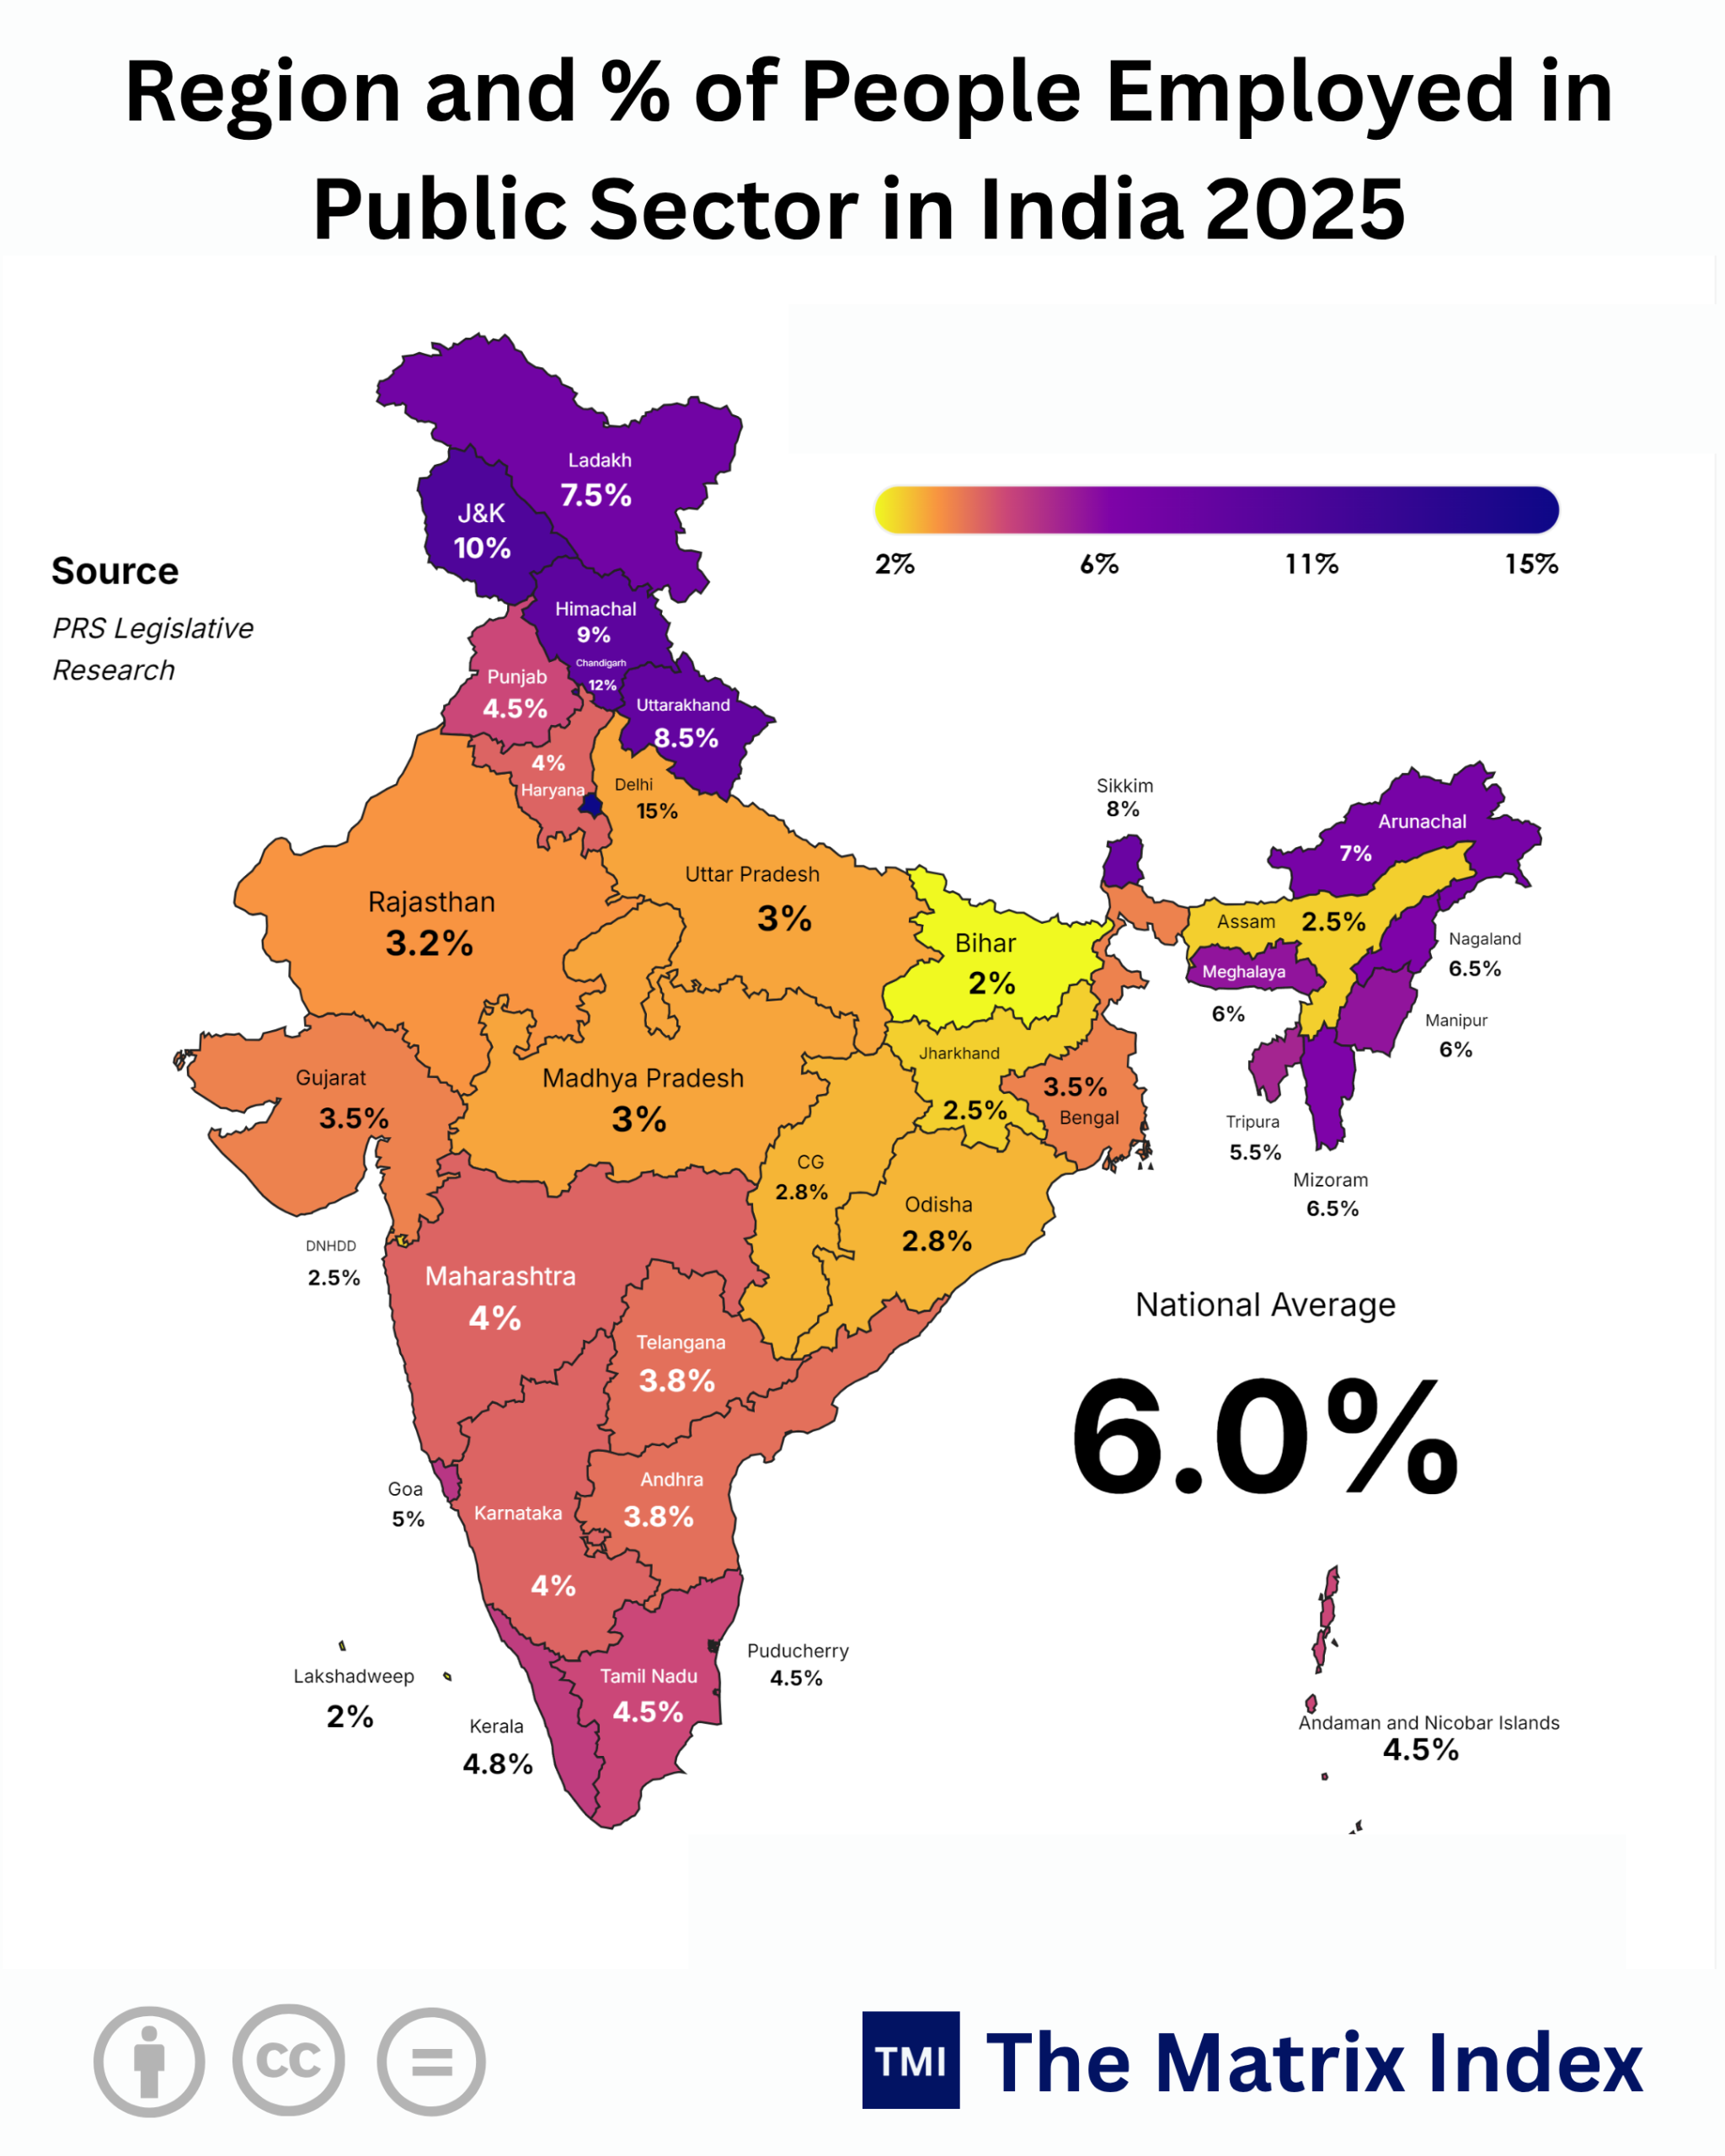
At the top of the density hierarchy sits Delhi at 15.0%, followed by Chandigarh at 12.0%, Jammu and Kashmir at 10.0%, Himachal Pradesh at 9.0%, and Uttarakhand at 8.5%.
Why are the national capital and northern hilly states dominating public workforce shares? In Delhi, the concentration of Union ministries, central agencies, defense establishments, and public corporate headquarters creates an unnatural concentration of administrative employment.
In the mountainous terrains of the Himalayas and the North-East such as Sikkim at 8.0%, Arunachal Pradesh at 7.0%, and Mizoram at 6.5% the private sector has historically struggled to establish large-scale manufacturing due to difficult logistics and rugged topography. In these regions, the state serves as both governance and primary employer.
Conversely, look at India’s demographic powerhouses: Bihar at 2.0%, Jharkhand at 2.5%, and Uttar Pradesh at 3.0%. These states sit at the bottom of public employment density. In these regions, the state apparatus is thin relative to total working populations, forcing massive populations into subsistence farming, informal trade, and cross-state migration.
Comprehensive Data: Public Sector Employment Across All 36 States & UTs
The following empirical register breaks down the distribution of government employment across every Indian State and Union Territory, highlighting both workforce share and absolute volume.
Table 1: State-by-State Public Sector Employment Breakdown (2025–2026)
High percentage states are often those with low private sector development. A high public workforce share frequently highlights a lack of private industrial investment.
Decoding the Volume Paradox: When Low Percentages Yield Millions of Jobs
The structural story shifts when transitioning from percentage shares to absolute volume.
An old economic adage holds that “Scale creates its own reality.” This principle is clearly visible across India’s state-level labor data.
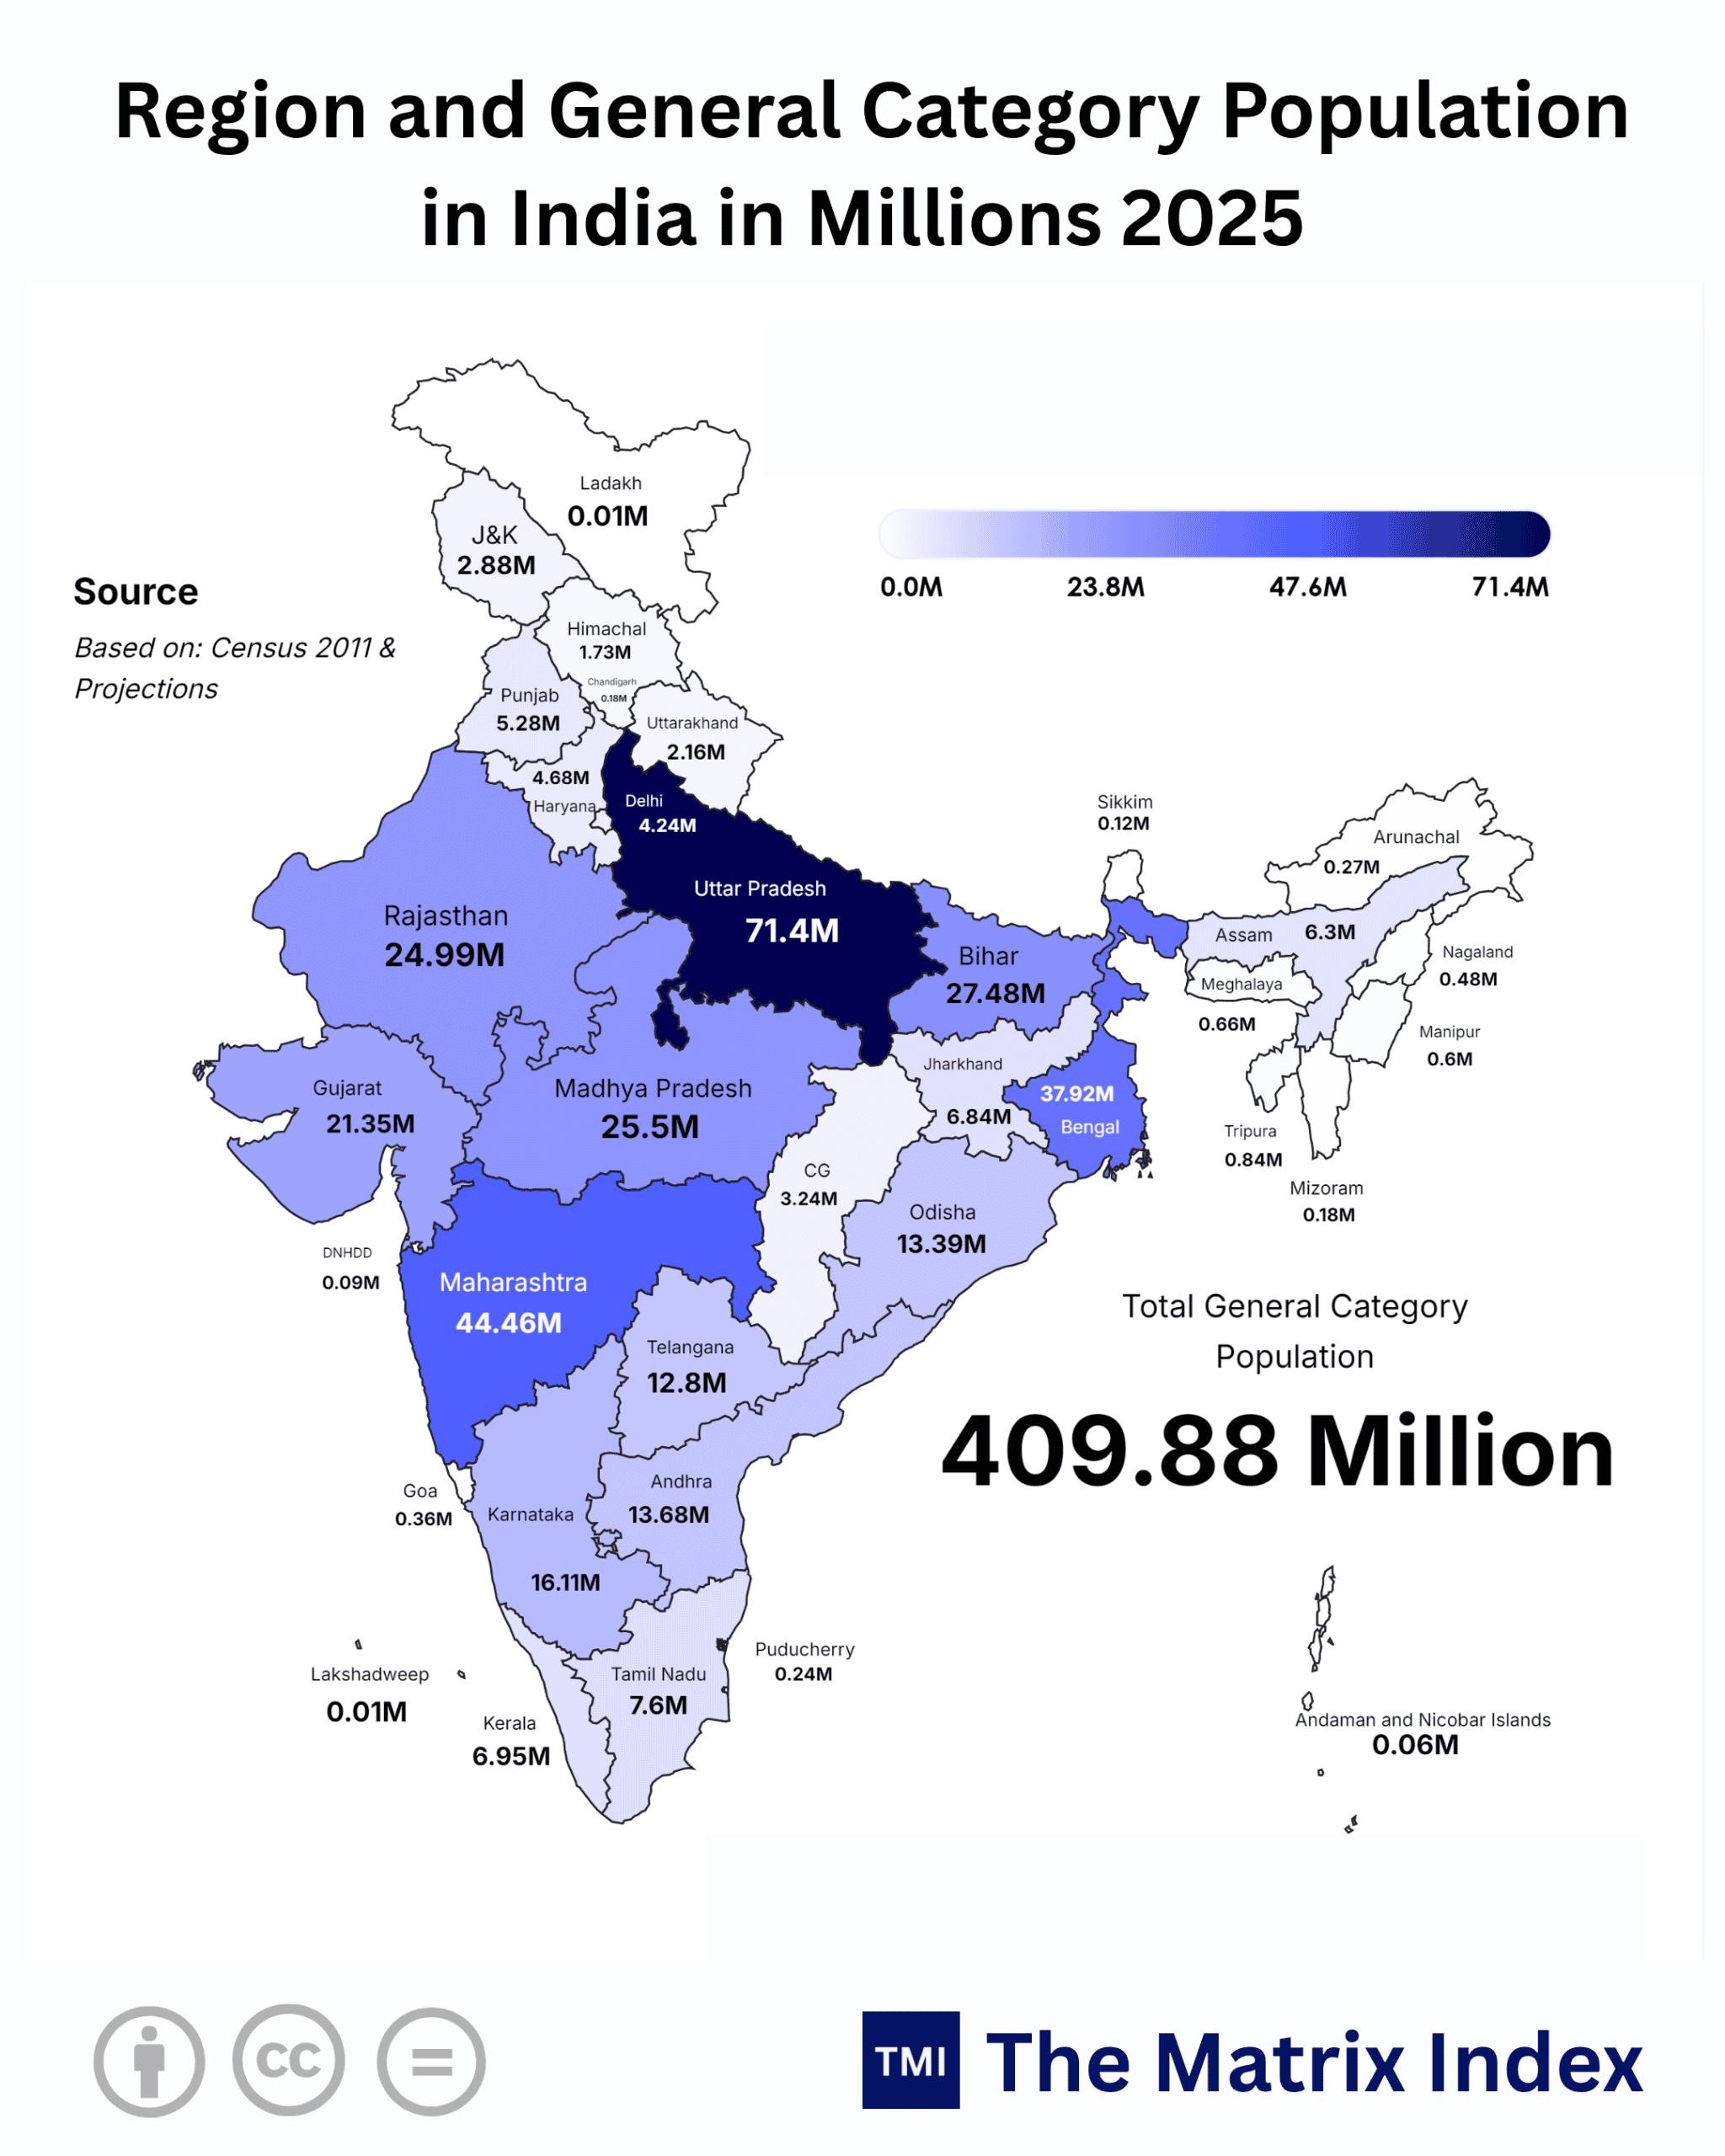
Uttar Pradesh, despite a modest public employment density of 3.0%, is home to 7.20 million public sector employees the largest concentration in the country. With a population exceeding 240 million and a labor force of roughly 120 million, running primary education, basic healthcare, civil policing, and revenue collection requires substantial administrative personnel.
Similarly, Maharashtra supports 4.80 million government employees with a 4.0% workforce share. Here, municipal corporations like the BMC, state power generation companies (MAHAGENCO), transit corporations (MSRTC), and state banking operations support large workforces.
Bihar employs 2.60 million public workers despite its 2.0% density. At the other end of the scale, Lakshadweep accounts for approximately 2,000 public workers (0.002 million) and Ladakh supports 10,000 (0.01 million).
Global Anchoring: How India Compares with International Labor Models
To understand whether India’s 6.0% public sector footprint is lean or overextended, we must evaluate it against global benchmarks across Tier-1 advanced economies and Tier-2 peer markets.
Table 2: Cross-Border Benchmark — Public Sector Share of Total Labor Force
India’s 6.0% public workforce ratio highlights a distinct structural difference compared to peers:
-
The Nordic & Western European Model (16%–30%): In nations like the UK (17%) or Sweden (29%), universal healthcare and free education are delivered primarily by state-employed professionals.
-
The East Asian State-Capitalism Model (China at 28%): China maintains millions of workers within state-owned enterprises (SOEs) producing steel, managing telecommunications, and building infrastructure.
-
The Indian Hybrid Reality (6%): India transitioned from early post-independence public industrial ownership (where public bodies represented nearly 69% of organized formal jobs) to a service-and-private-led growth model post-1991. The modern Indian state maintains a relatively compact administrative core relative to its overall population.
The “So What?” Factor: Deconstructing the Great Indian Wage & Security Premium
Why do millions of Indian university graduates compete for junior administrative positions when the public sector accounts for only 6% of the workforce?
The answer lies in the Wage & Security Gap between unorganized private work and entry-level public employment.
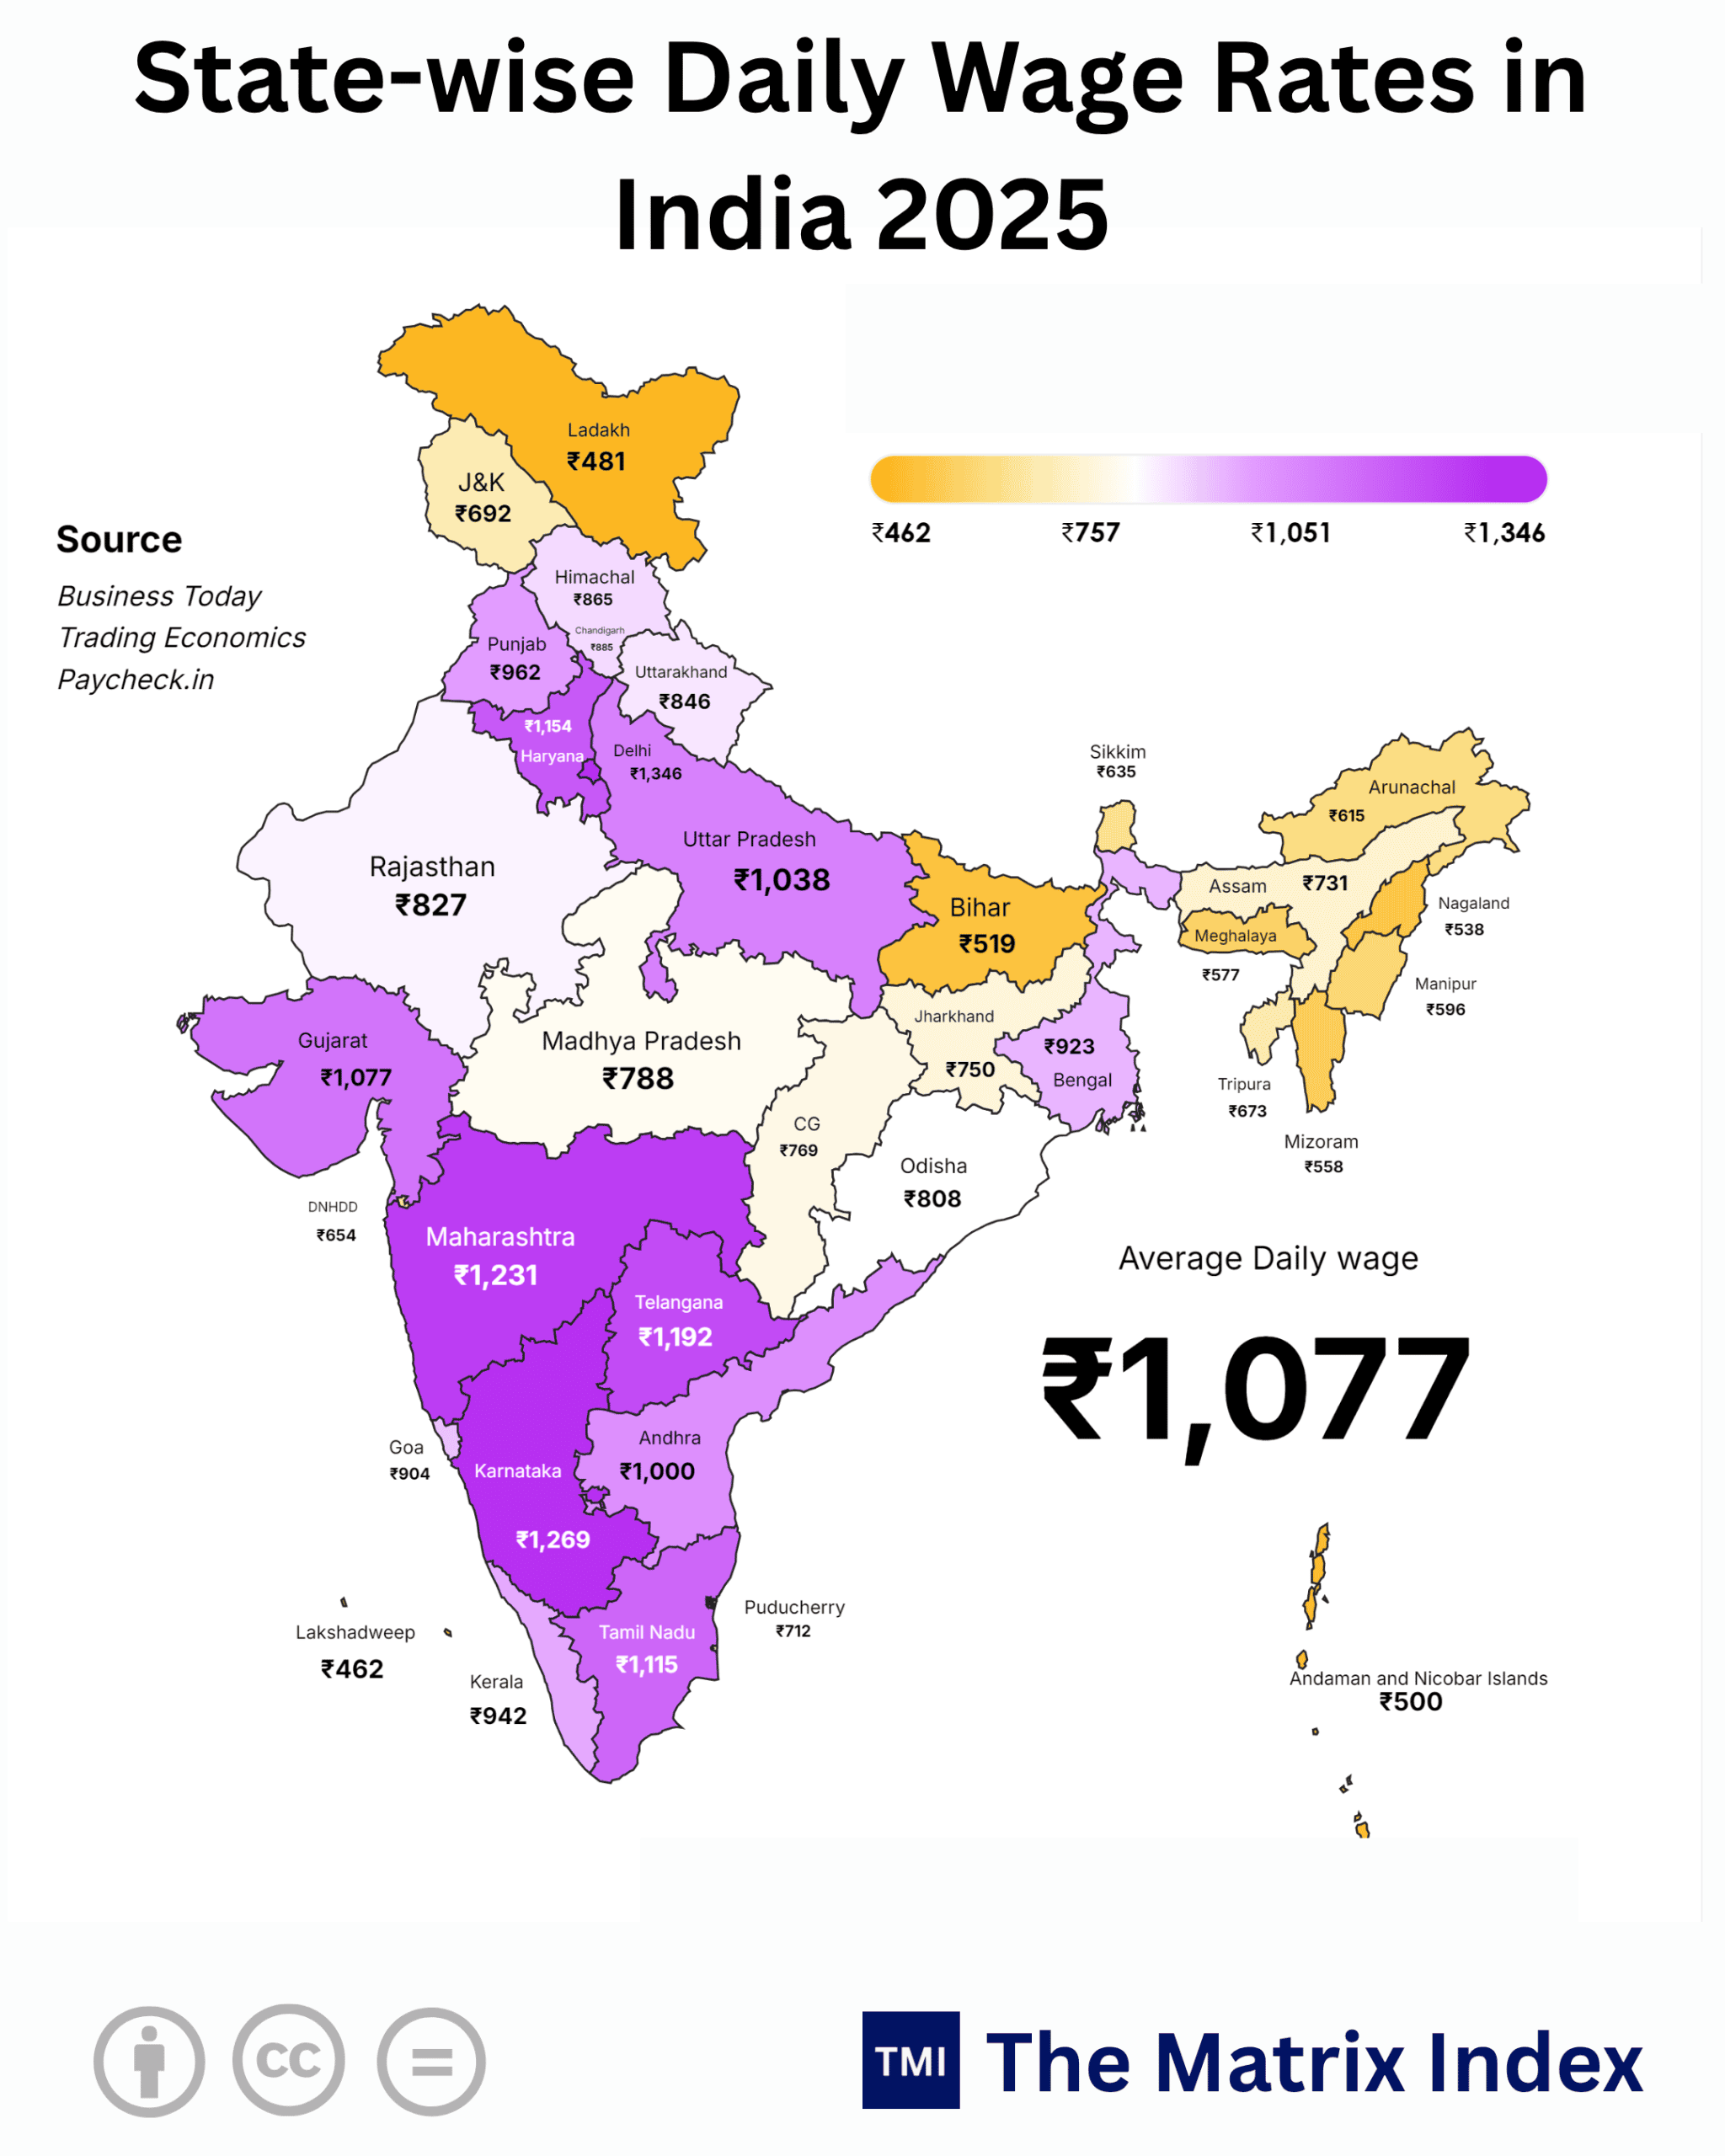
The average monthly wage in India hovers around ₹28,000 ($337 / €307 / £256), but this aggregated figure includes significant regional variations:
-
An unorganized worker in Bihar often earns around ₹10,800 per month.
-
An entry-level private retail worker in Tier-2 cities often takes home ₹14,000–₹16,000 without healthcare benefits, paid leave, or severance protection.
-
By contrast, a government school teacher in Delhi starts at approximately ₹35,000 per month (~₹1,346/day), accompanied by Dearness Allowance (DA), structured pensions, and job stability.
This economic spread transforms public sector recruitment into a high-stakes competition. When an Indian Railways or state commission publishes an intake notice for 10,000 vacancies, applications regularly exceed 5 to 8 million candidates.
This dynamic can lead to a misallocation of human capital, as young professionals spend years in competitive exam preparation rather than building skills in the private market.
Seasonality, Anomaly Alert, and Fiscal Sustainability
When looking at the growth of public sector headcount to 39 million in 2025–2026, analysts must account for structural shifts versus periodic recruitment cycles:
-
The Recruitment Cycle Spike: Announcements around central and state recruitment drives often create short-term expansions in reported hiring numbers.
-
The Fiscal Reality Check: State budgets face clear mathematical limits. In states like Punjab, Himachal Pradesh, and Kerala, committed expenditures comprising salaries, pensions, and debt servicing frequently consume 55% to 75% of total own-tax revenues.
-
Structural Outsourcing: To manage these balance sheet commitments, state utilities and municipal bodies increasingly turn to contractual and specialized service agreements. While headcount may appear stable, the core permanent civil service remains closely managed.
Hypothetical Counter-Narrative: What If India Expanded to Global Public Ratios?
Consider an alternative scenario: What if India expanded its public sector from 6% to 15% to match US or UK ratios?
Expanding the public payroll to 97.5 million workers under existing compensation models would create significant fiscal pressure:
-
Capital Expenditure Displacement: Infrastructure investments in ports, freight corridors, and power transmission would face severe budget competition from recurring payroll costs.
-
Private Market Crowding Out: A large-scale expansion of secure state jobs could limit the talent pool available for private technology, electronics, and manufacturing sectors.
-
The Digital Public Infrastructure Solution: Rather than adding millions of administrative roles, India has largely focused on digital platforms such as UPI, ONDC, and automated portals to deliver citizen services efficiently at scale.
Strategic Risk Assessment: Bull vs. Bear Outlook
The Bull Case
-
Private Manufacturing Expansion: Initiatives in electronics, semiconductors, and green energy successfully transition labor from agriculture into formal private manufacturing.
-
Service Ecosystem Dispersion: Global Capability Centers (GCCs) and IT hubs expand beyond Bengaluru and Pune into Tier-2 and Tier-3 cities across Uttar Pradesh, Madhya Pradesh, and Odisha.
-
Formalization of Private Benefits: Broader adoption of portable social security and standardized benefits narrows the gap between private and public sector stability.
The Bear Case
-
The Examination Bottleneck: Millions of youth continue spending productive years preparing for scarce public vacancies, creating long-term career gaps.
-
State Balance Sheet Pressures: Unfunded pension commitments and state debt limit capital investments needed for regional infrastructure development.
-
Labor Transition Challenges: Mechanization in agriculture outpaces formal industrial job creation, increasing dependence on informal urban labor.
My Verdict: Vision 2030–2047 Roadmap
An economy of 1.45 billion people cannot rely primarily on the state as an employer of first resort.
Moving toward Vision 2047, economic policy should focus on three clear structural adjustments:
-
Industrializing the Northern Plains: States like Bihar (2.0%) and Uttar Pradesh (3.0%) must develop specialized manufacturing zones and logistics infrastructure to offer formal private careers at scale.
-
Reallocating the Public Footprint: Rather than expanding administrative roles, public investment should prioritize frontline healthcare, technical education, and judicial capacity.
-
Expanding Portable Private Social Security: Strengthening universal healthcare access and portable retirement programs helps reduce the perceived security gap between public and private employment.
The path toward an industrialized, high-income economy depends on building a dynamic private ecosystem where broad-based economic security does not rely solely on securing a government post.
GOOGLE ‘PEOPLE ALSO ASK’ FAQs
Q1: What percentage of India’s total workforce is employed in the public sector? A: Exactly 6.0% of India’s 650 million workforce equating to 39 million individuals holds public sector jobs in 2026. The remaining 94% operate entirely within the private, agricultural, or unorganized sectors without equivalent state-backed protections.
Q2: Which Indian state has the highest percentage of public sector employment? A: Delhi leads nationwide with 15.0% of its workforce employed in the public sector due to central ministries and state enterprises. Chandigarh follows at 12.0%, while Jammu and Kashmir ranks third at 10.0% administrative and security density.
Q3: Which Indian state employs the largest absolute number of government workers? A: Uttar Pradesh ranks first with 7.20 million public sector workers, despite a low 3.0% state workforce density. Maharashtra ranks second with 4.80 million employees, followed by West Bengal at 2.80 million and Bihar at 2.60 million.
Q4: How does India’s public sector employment ratio compare to global economies? A: India’s 6.0% public workforce share is significantly lower than China’s 28.0%, the United Kingdom’s 17.0%, and the United States’ 15.0%. Advanced Nordic nations lead globally, maintaining public employment levels between 29.0% and 31.0%.
Q5: Why is competition so intense for public sector jobs in India? A: Public roles offer entry salaries starting around ₹30,000–₹35,000 alongside dearness allowances and pensions, exceeding average informal wages of ₹10,800. This stark wage and social security disparity drives millions of candidates to contest limited vacancies.
Data Sources & Empirical References
-
Ministry of Labour and Employment, Government of India (Workforce Data Series).
-
Periodic Labour Force Survey (PLFS) Reports.
-
PRS Legislative Research: State-Wise Public Sector & Governance Analysis.
-
International Labour Organization (ILO): Global Wage & Public Employment Databases.
-
OECD Public Employment Data (Tier-1 Advanced Nation Benchmarks).
-
Reserve Bank of India (RBI): State Finances: A Study of Budgets (Committed Liabilities).
Disclaimer: This report is for informational and analytical purposes only and does not constitute formal financial, investment, or policy advice.