NEW DELHI, India — The most explosive economic narrative of the twenty-first century is not hidden in algorithmic trading floors or semiconductor fabs; it sits squarely across the agricultural belts and tier-2 manufacturing corridors of India, embodied in an unprecedented demographic cohort: 647 Million people belonging to the Other Backward Classes (OBC).
This is not a mere statistical footnote or a talking point for electoral rallies. 647 Million individuals represent an aggregate demographic engine larger than the combined populations of the United States (340 Million) and western Europe’s core economies Germany (84 Million), the United Kingdom (68 Million), and France (66 Million).
To look at this map is to stare directly into the engine room of India’s economic future and its most terrifying fault line. If this massive productive base is integrated into capital formation, skill-intensive industries, and asset-backed wealth creation, India’s march toward a $30 Trillion GDP by 2047 is unstoppable. If it remains trapped in low-yield informal labour, masked under-employment, and policy tokenism, the demographic dividend will curdle into structural stagflation.
The Geographic Concentration of Productive Capital
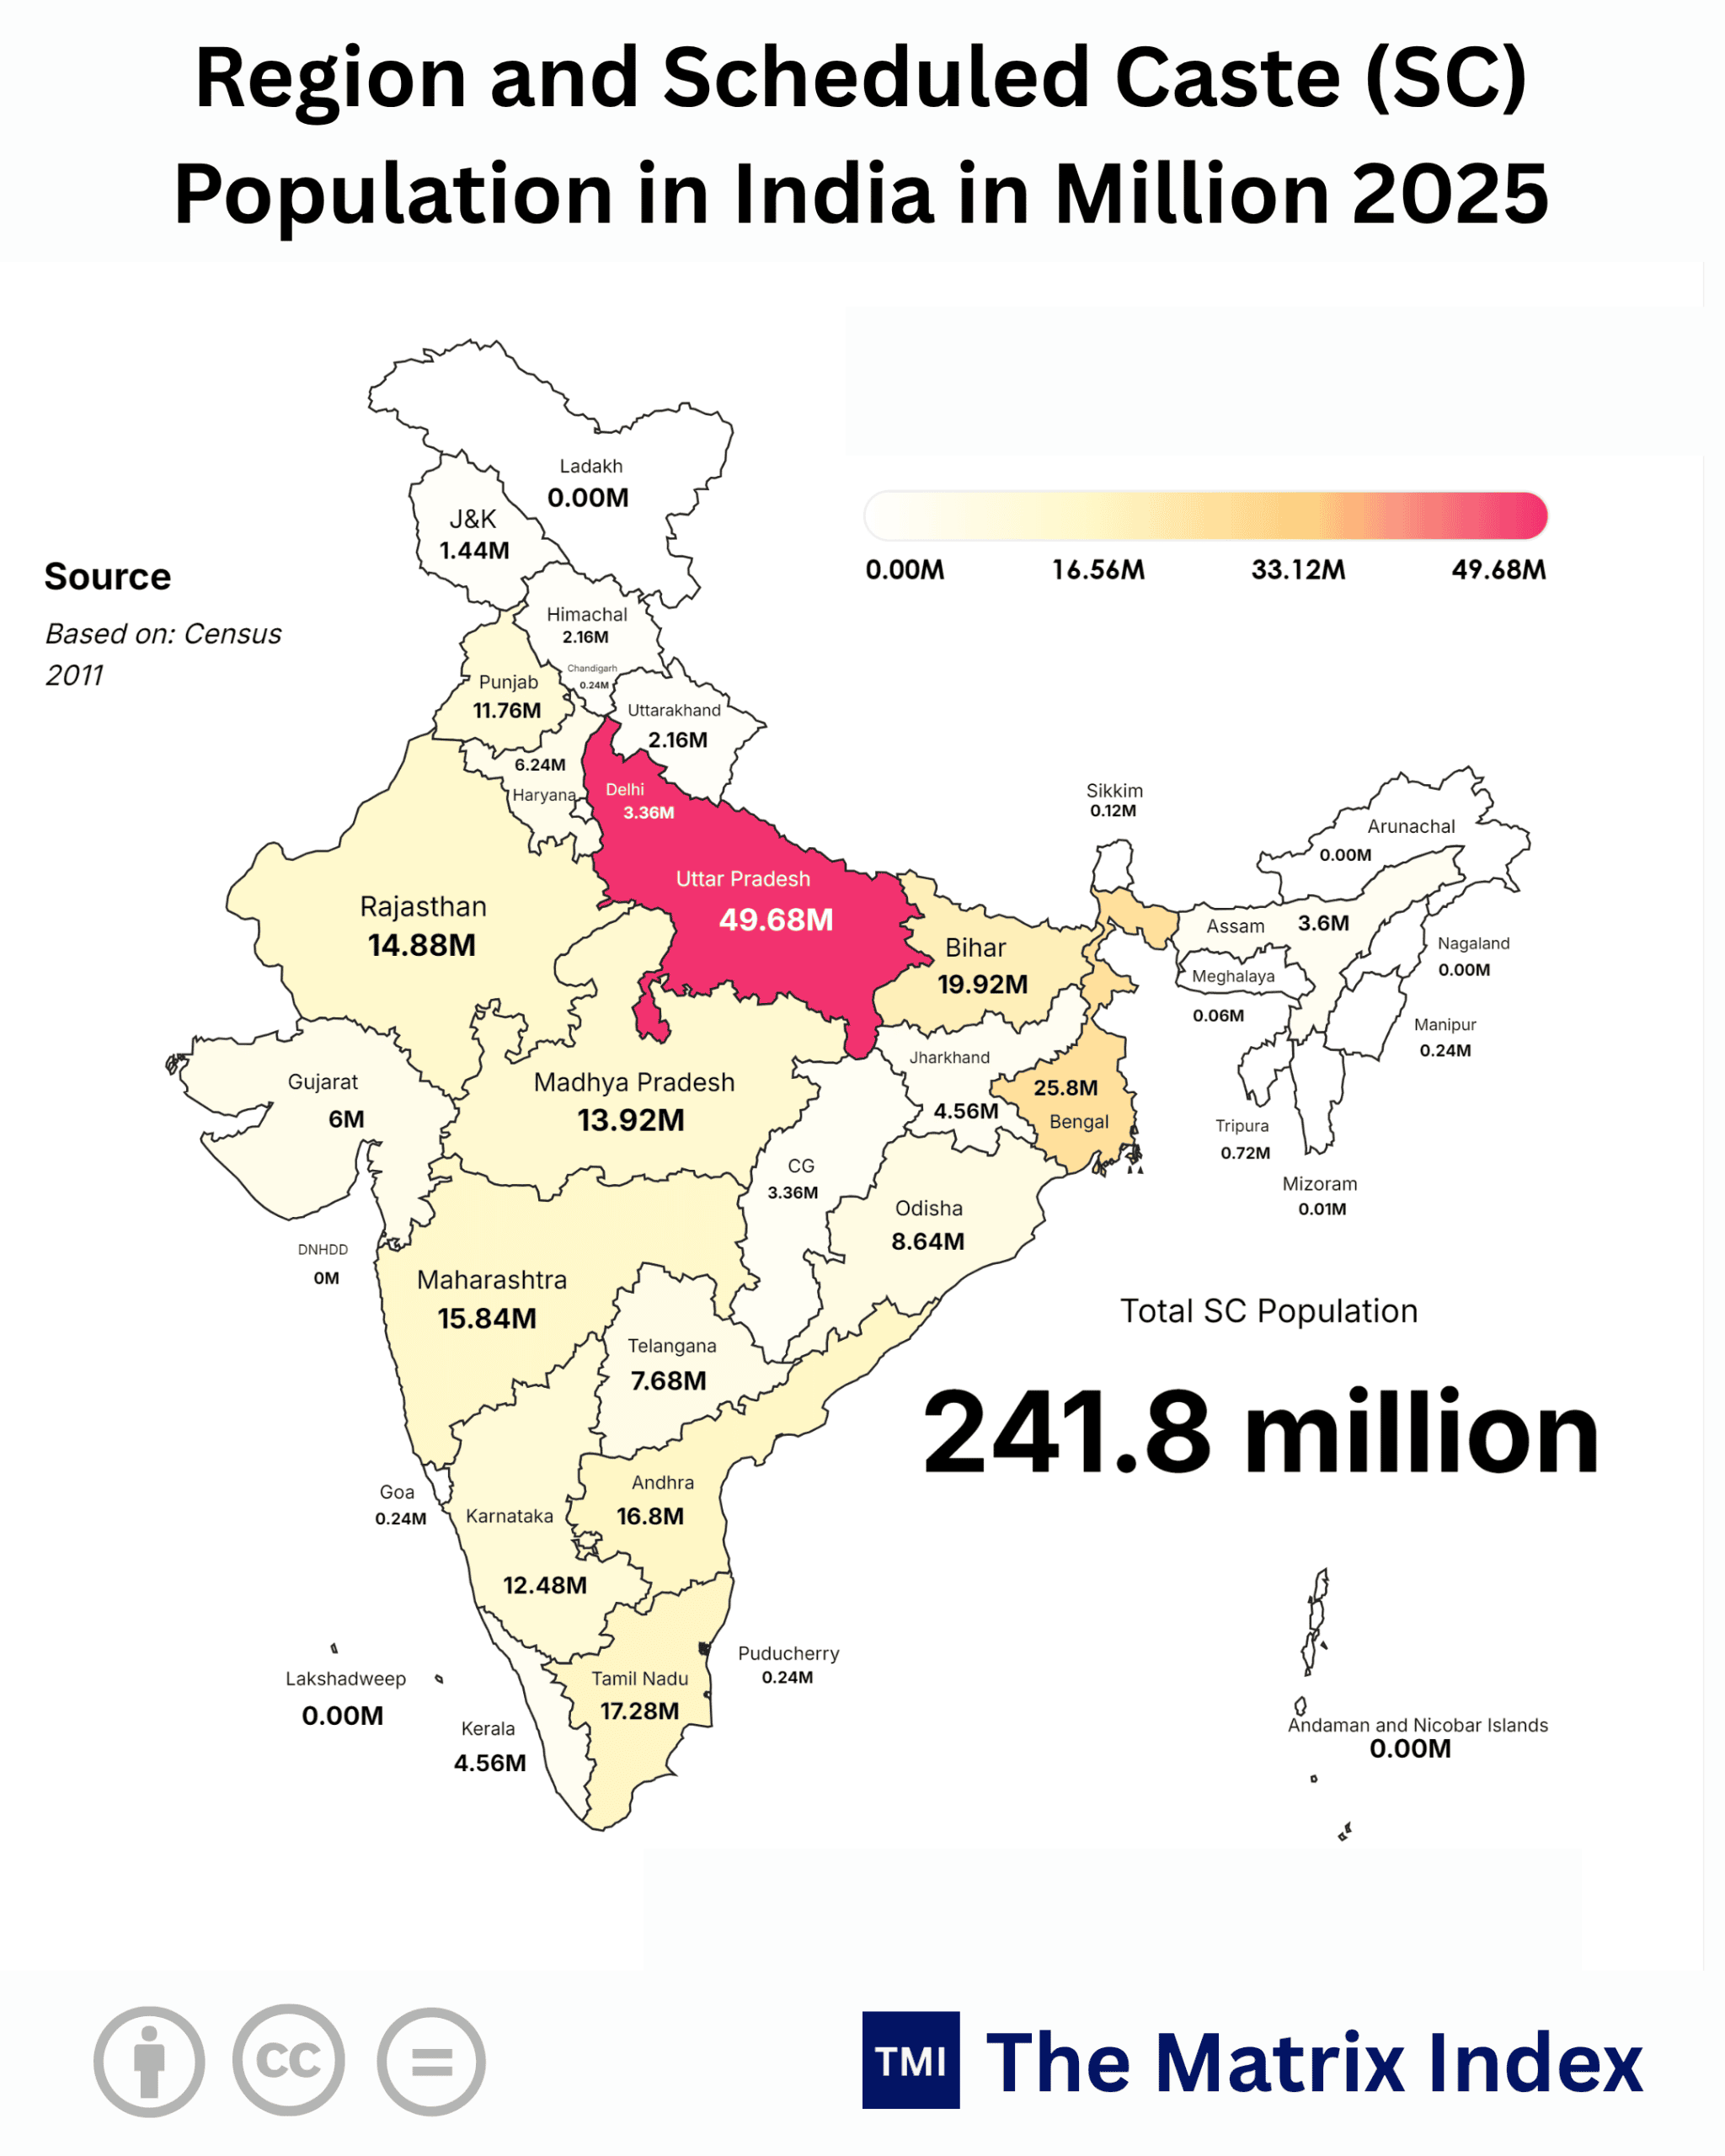
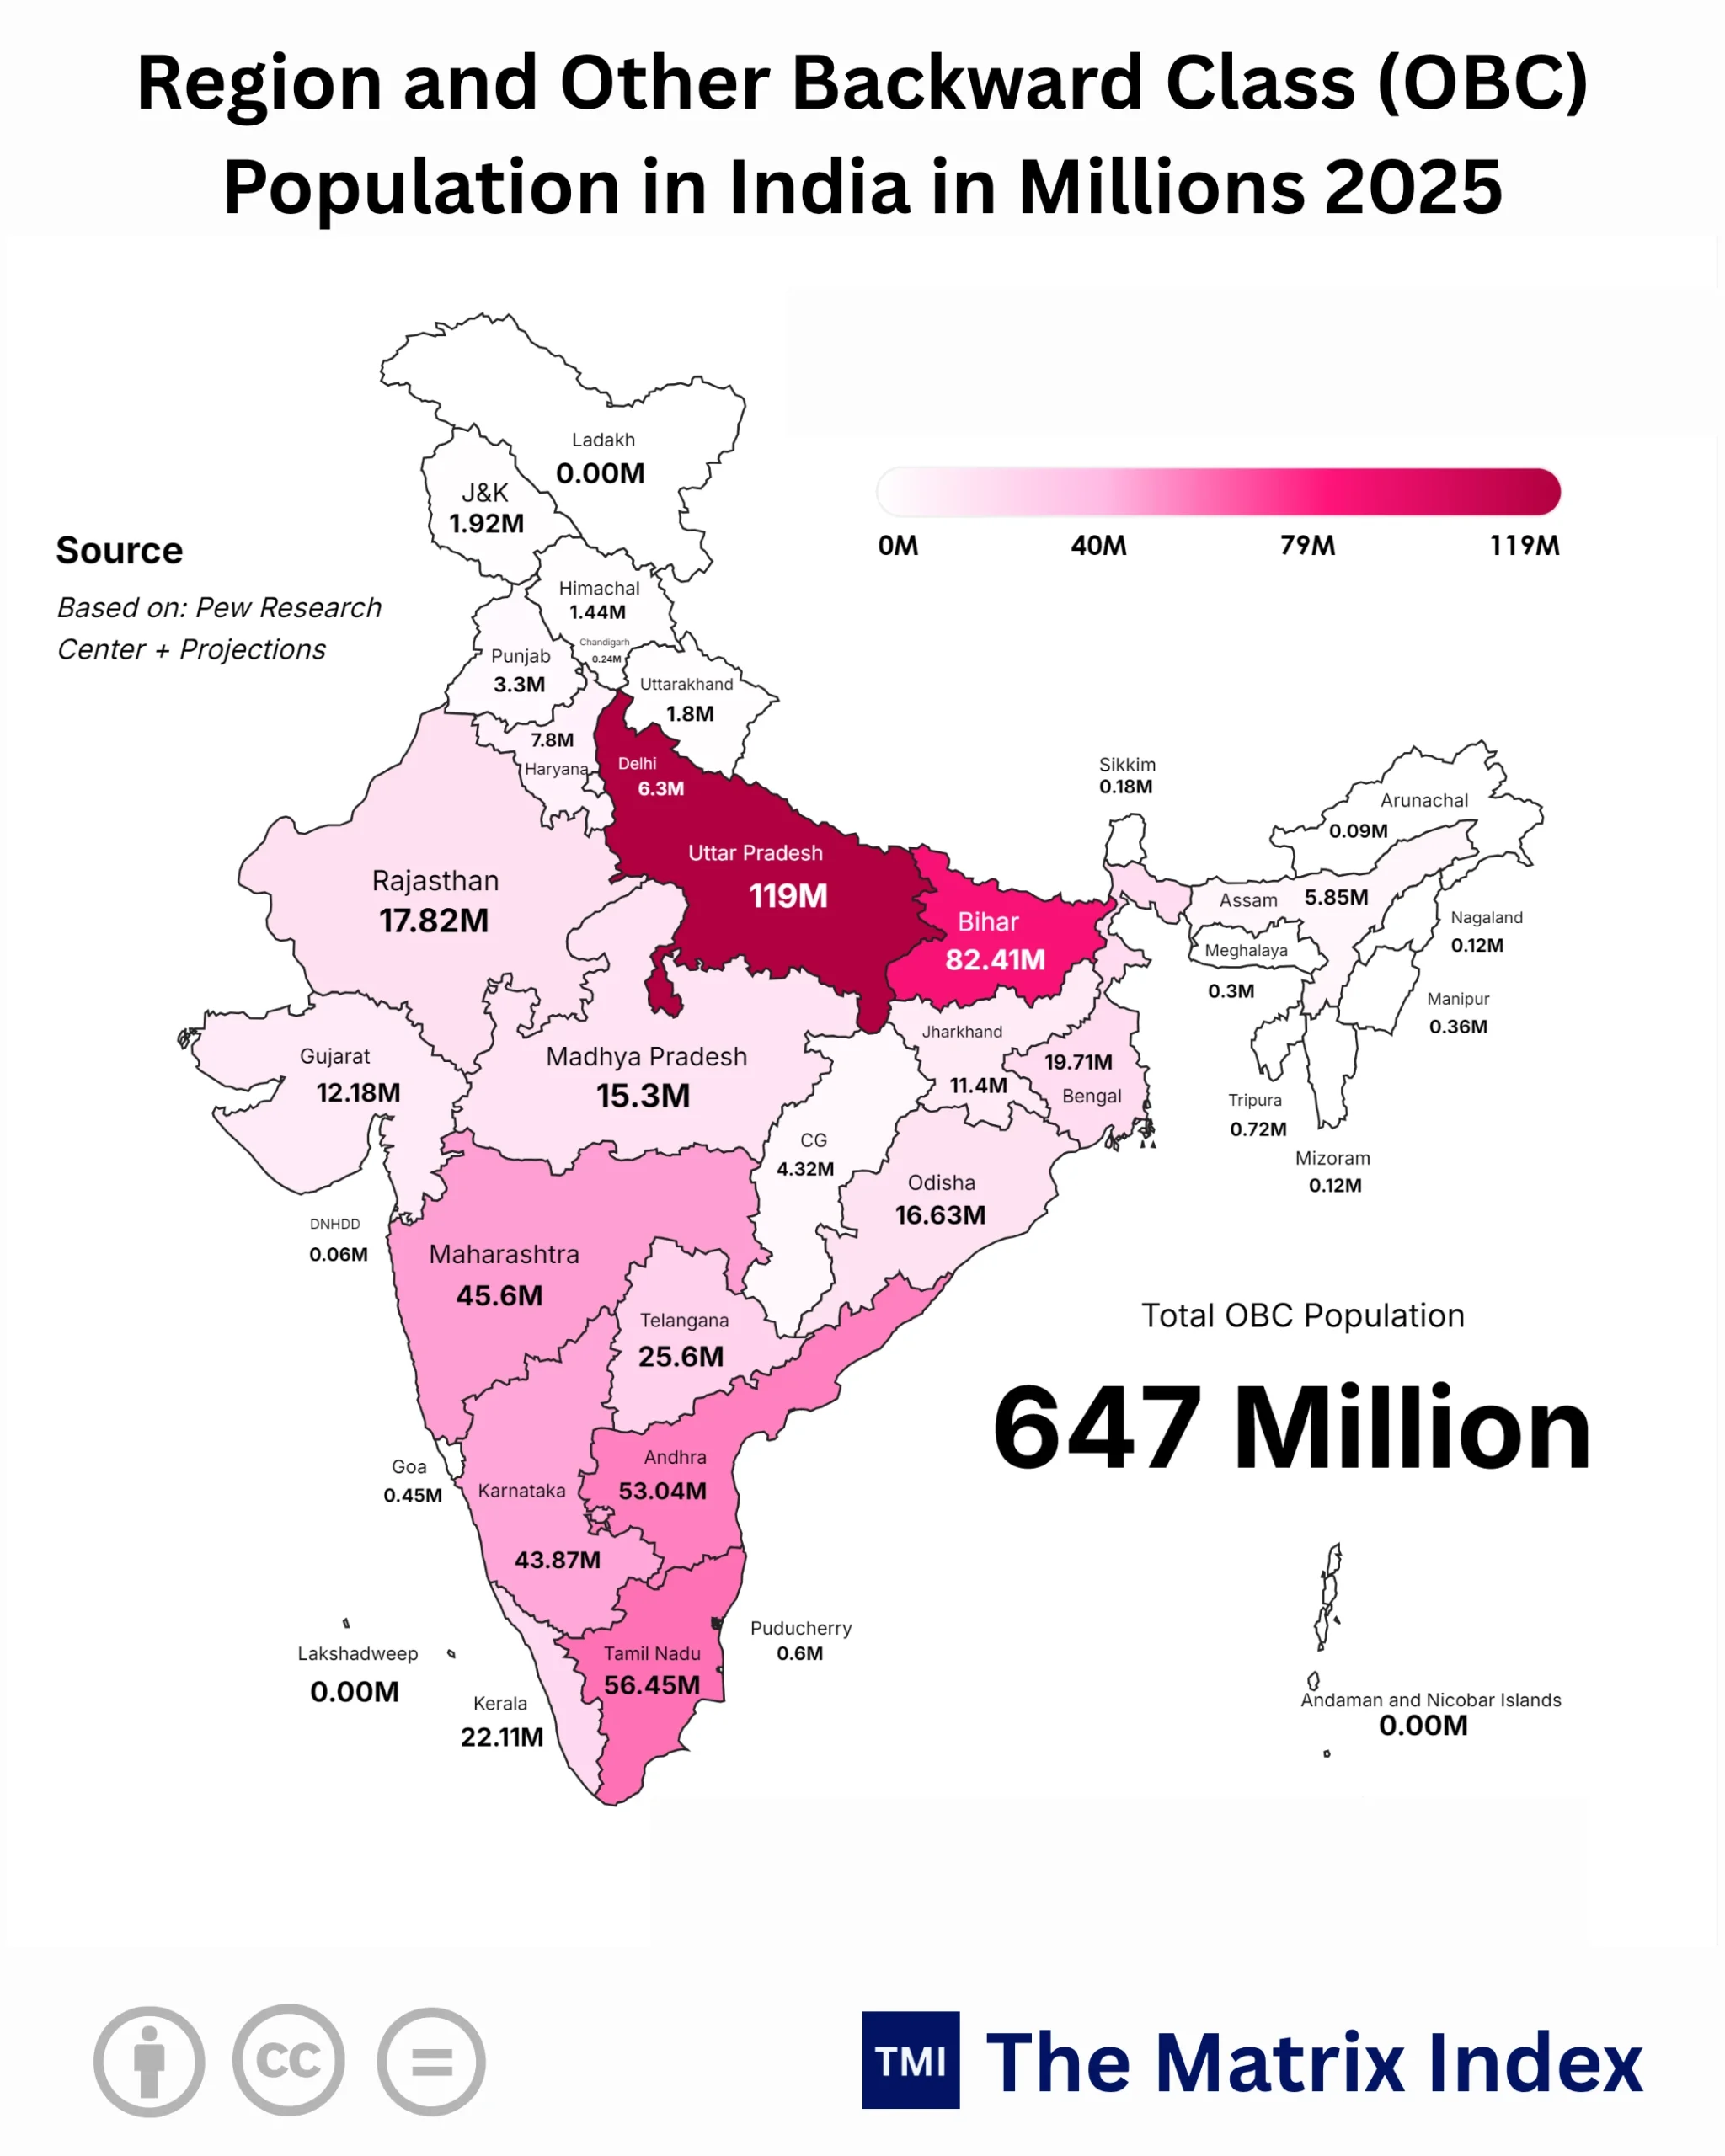
A forensic analysis of the geospatial dataset reveals an intense geographic concentration that defies standard decentralized growth models. The northern agrarian basin anchored by Uttar Pradesh (119M) and Bihar (82.41M) accounts for over 201.41 Million OBC citizens. That is nearly 31.1% of the entire national OBC aggregate concentrated in just two contiguous states.
Contrast this northern heavy-mass with the industrialised southern corridor:
-
Tamil Nadu: 56.45 Million
-
Andhra Pradesh: 53.04 Million
-
Karnataka: 43.87 Million
-
Telangana: 25.6M
-
Kerala: 22.11 Million
Combined, the southern states command an OBC population exceeding 201 Million, almost mirroring the northern aggregate in raw scale, but operating in an entirely divergent institutional framework of human capital accumulation, industrialization, and service-sector absorption.
Meanwhile, western heavyweights like Maharashtra (45.6M), Rajasthan (17.82M), and Gujarat (12.18M) provide the supply-chain backbone for India’s export engine. In the east and central belts, West Bengal (19.71M), Odisha (16.63M), and Madhya Pradesh (15.3M) maintain substantial demographic reserves that remain largely decoupled from high-tier financialization.
Regional Distribution and Economic Footprint of India’s OBC Demographics (2025–2026)
The northern powerhouse of Uttar Pradesh and Bihar houses over 201 Million OBC citizens, yet captures less than 14% of institutional venture capital and private corporate capex compared to the Southern-Western corridor.
The “So What?” Factor: Deconstructing the Macroeconomic Ripple Effect
Economic metrics do not exist in an academic vacuum. When 647 Million citizens occupy specific productive tiers, the structural consequences directly shape inflation, credit quality, real estate cycles, and industrial output.
1. The Real Wage Trap vs. Private Consumption
A massive proportion of the 119 Million in Uttar Pradesh and 82.41 Million in Bihar remains tied to agricultural supply chains and micro-enterprises. Unlike tier-1 benchmark economies such as the United States or Germany, where labor transitions seamlessly into high-value automation, India’s base is vulnerable to food inflation shocks. When rural wages stagnate, discretionary consumption for entry-level fast-moving consumer goods (FMCG), two-wheelers, and affordable housing drops immediately.
2. Credit Deepening and Informal Financing
Traditional commercial banks struggle to underwrite micro-enterprises run by artisan and occupational communities without formal collateral. This creates an enormous credit vacuum. Non-Banking Financial Companies (NBFCs) and microfinance institutions (MFIs) step in, but often at effective interest rates of 18% to 24%, severely restricting capital reinvestment compared to the ultra-low-cost SME debt available in Japan or China.
3. The Industrial Upgrading Bottleneck
The southern model (Tamil Nadu’s 56.45M and Karnataka’s 43.87M) proves that when OBC communities transition into precision engineering, automotive clusters, and electronics manufacturing, per capita gross state domestic product (GSDP) surges. If northern states fail to replicate this industrial ladder, India will suffer from a “two-speed economy” where southern and western corridors subsidize northern consumption through fiscal transfers.
Seasonality, Structural Trends, and Anomalies
Is the economic footprint of this massive demographic cohort a permanent industrial asset or a seasonal buffer?
Economic strategists must separate cyclical noise from structural reality:
-
The Agricultural Harvest Cycle (Rabi/Kharif Shifts): In states like Madhya Pradesh (15.3M) and Rajasthan (17.82M), rural consumption spikes dramatically post-harvest in November–December and April–May. These surges are frequently misread by institutional investors as structural bull runs in retail consumption, whereas they reflect seasonal working-capital liquidity.
-
Electoral Fiscal Splurges: State election cycles trigger targeted direct benefit transfers (DBTs), loan waivers, and welfare allocations. These produce temporary, artificial spikes in rural credit demand that normalize within two quarters post-election.
-
The Permanent Megatrend Urban Migration: Beyond seasonal noise, the permanent migration of young OBC workers into tier-1 and tier-2 urban agglomerations (Delhi’s 6.30M, Bengaluru, Pune, and Hyderabad) is fundamentally reshaping India’s gig economy, construction logistics, and urban consumption profile.
Comparative Policy Frameworks: India vs. Global Economic Benchmarks
Bridging India’s < 12% vocational skill certification gap to match Germany’s 75% dual-education standard could unlock an estimated $1.8 Trillion in incremental industrial manufacturing output by 2035.
The Alternative Scenario: The Cost of Policy Inertia
What happens if current capital-deepening and educational policies stall?
Under an alternative scenario where global protectionism accelerates and domestic manufacturing fails to absorb 10 to 12 Million new job seekers annually:
-
Fiscal Drag: Welfare outlays would shift from asset-creation capital expenditure (roads, industrial parks, cold chains) to non-productive revenue expenditure (consumption subsidies, direct cash transfers), inflating the fiscal deficit beyond sustainable 6% of GDP thresholds.
-
Capital Misallocation: Private corporate investment would retreat into capital-intensive, automated software and financial silos, widening the wealth gap between asset owners and the informal labor force.
-
Brain Waste and Underemployment: Millions of semi-skilled youth across Bihar (82.41M) and Uttar Pradesh (119M) would remain trapped in low-productivity platform-gig roles or marginal farming, capping India’s potential GDP growth rate at 5.5% rather than the required 8% to 9% trajectory.
Bull vs. Bear Case: The 2026–2047 Economic Trajectory
Bull Case: The $30 Trillion Industrial Powerhouse
-
MSME Formalization: Seamless integration of traditional artisan and manufacturing clusters through digitized supply chains and cheap credit lines.
-
Southern-Northern Convergence: Northern states (UP, Bihar, MP) establish mega-industrial corridors mirroring the export-led growth of Tamil Nadu and Gujarat.
-
Global Supply Chain Replacement: India absorbs 15% to 20% of global light-manufacturing capacity fleeing aging demographics in East Asia, powered by a trained, young OBC workforce.
-
Asset-Backed Wealth Creation: Financial inclusion shifts from simple bank account opening to systematic equity, mutual fund, and real-estate wealth generation for tier-2/3 households.
Bear Case: The Demographic Trap
-
Mechanization Without Absorption: Automation and AI eliminate entry-level manufacturing and back-office jobs before the informal workforce is upskilled.
-
Human Capital Deficit: Persistent gaps in technical education, healthcare infrastructure, and nutrition cap labor productivity well below Tier-1 benchmarks (USA, Germany, Japan).
-
Regional Polarization: Widening fiscal and economic divergence between industrialized southern/western states and high-population northern states, creating structural imbalances in national resource allocation.
-
Credit Bubbles in Unsecured Lending: Over-leveraging of low-income informal households via high-cost digital micro-lending apps, resulting in elevated non-performing asset (NPA) cycles.
(My Verdict): Strategic Outlook for 2026, 2030, and 2047
Demographics are not destiny; policy execution and capital allocation are. As an economic strategist looking at the cold reality of 647 Million people, tokenistic political promises will not build a high-income nation.
Key Predictions:
-
By 2030: India’s manufacturing competitiveness will be decided not in boardroom towers in Mumbai, but across tier-2 and tier-3 industrial clusters in Tamil Nadu (56.45M), Maharashtra (45.6M), and Uttar Pradesh (119M). The states that provide localized industrial infrastructure, uninterrupted green power, and zero-bureaucracy credit will dominate private capex inflows.
-
By 2040: A massive inter-state demographic transfer will peak. Northern youth from Bihar and Uttar Pradesh will structurally sustain the aging industrial supply chains of southern and western states, necessitating pan-India portability of social safety nets, healthcare, and housing frameworks.
-
By 2047 (Viksit Bharat Roadmap): India’s ambition to match the high-income benchmarks of the United States, Germany, and Japan will succeed only if the economic productivity of this 647 Million strong cohort achieves parity with global Tier-1 manufacturing labor standards.
The Bottom Line: Treat this demographic map not as an administrative census, but as the master blueprint of India’s macroeconomic balance sheet. The capital deployed here today determines whether India becomes the world’s primary industrial workshop or remains an unrealized economic promise.
GOOGLE ‘PEOPLE ALSO ASK’ FAQs
Q1. What is the total OBC population in India according to recent data?
647 Million citizens comprise India’s total OBC demographic cohort. This population exceeds the combined aggregate headcounts of the United States, Germany, the United Kingdom, and France.
Q2. Which Indian states hold the largest OBC population concentration?
119 Million in Uttar Pradesh and 82.41 Million in Bihar represent over 31.1% of India’s total OBC demographic base. The southern corridor led by Tamil Nadu’s 56.45 Million forms the primary counter-cluster.
Q3. Why is India’s 647 Million OBC cohort critical for the 2047 GDP vision?
$30 Trillion GDP targets by 2047 depend directly on integrating this 647 Million workforce into high-yield industrial manufacturing. Failure to upgrade rural productivity risks severe structural stagflation.
Q4. What is the vocational skill gap among India’s OBC workforce?
Under 12% of this demographic cohort currently possesses formal vocational skill certification, compared to Germany’s 75% dual-VET standard. Closing this deficit could unlock $1.8 Trillion in industrial output by 2035.
Q5. How does regional OBC population distribution affect India’s industrial growth?
201.41 Million northern OBC citizens face high disguised agrarian under-employment, whereas 199 Million across southern and western corridors drive export manufacturing. This structural divergence creates an asymmetric two-speed economy.
Data Sources:
- Pew Research Center Demographic Databases
- National Sample Survey Projections
- State Economic Surveys
- Reserve Bank of India Regional Banking Statistics.
Disclaimer: This report is for informational and analytical purposes only and does not constitute formal financial, investment, or policy advice.