The Great Indian Wage Divide: Deconstructing the ₹1,077 Illusion, Internal Migration Fractures, and the Global Competitiveness Trap
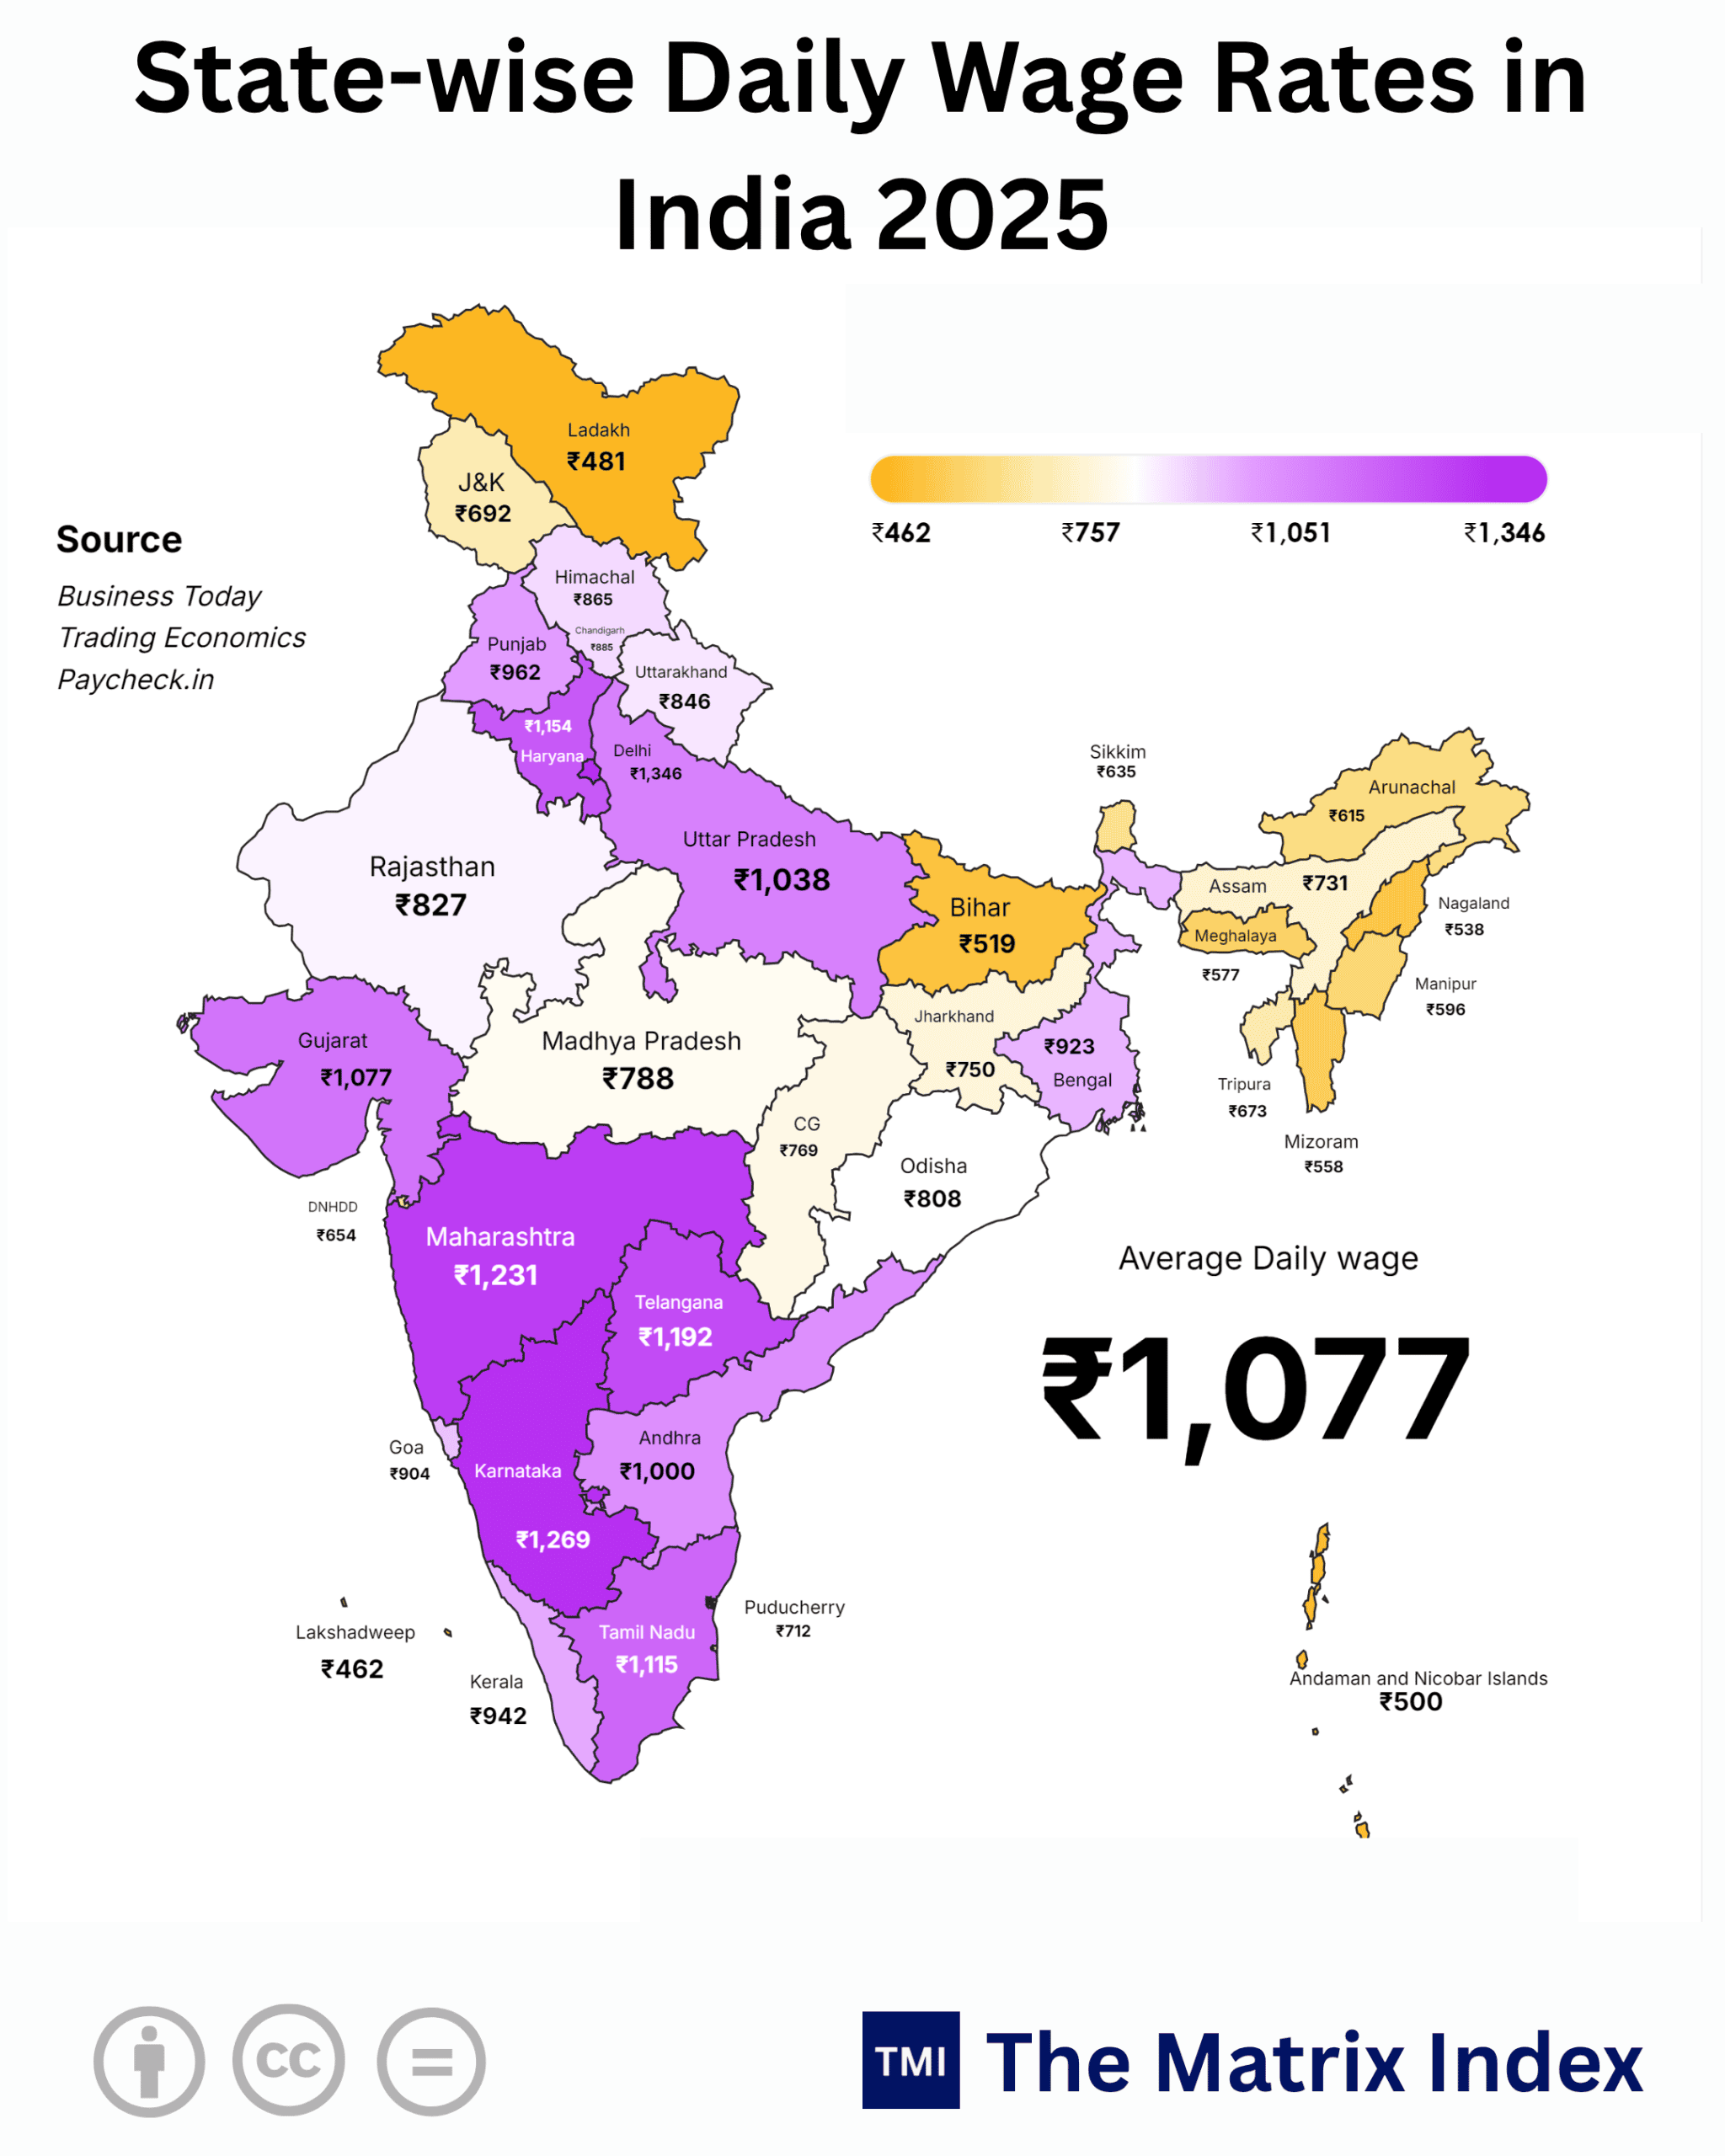
NEW DELHI, India — The headline figure looks triumphant on paper: an Average Daily Wage of ₹1,077 across the world’s fifth-largest economy. Yet, behind this statistical average lies an economic fracture line dividing the sub-continent into two distinct realities.
A worker laying bricks in Delhi earns ₹1,346 per day, while an identical laborer across the border in Bihar struggles at ₹519. That is an institutionalized 159.3% wage chasm within a single sovereign market. When a single nation tolerates a nearly three-fold divergence in base labor compensation between neighboring states, it does not have an integrated labor market; it operates two decoupled economic universes under one flag.
The Anatomy of the Wage Map: A Sub-Continental Fracture
The wage topography reveals clear economic clusters:
-
The High-Yield Industrial & Services Core: The southern-western belt—spanning Karnataka (₹1,269), Maharashtra (₹1,231), Telangana (₹1,192), Tamil Nadu (₹1,115), and Gujarat (₹1,077)—commands high wage floors driven by urbanization and industrial capital depth.
-
The Northern Capital Hub: Delhi (₹1,346) and Haryana (₹1,154) operate on dense urban service premiums, whereas Uttar Pradesh (₹1,038) and Punjab (₹962) reflect heavy regional transitions.
-
The Stagnant Periphery: The eastern and frontier zones—including Bihar (₹519), Jharkhand (₹750), Chhattisgarh (₹769), Ladakh (₹481), and Lakshadweep (₹462)—remain trapped in subsistence wage dynamics.
State-by-State Daily Wage Landscape
(The Bitter Truth): Over 40% of the working population resides in states where the prevailing wage rate sits 25% to 52% below the national average. This sustains structural domestic remittance drains and strains public municipal infrastructure across major western and southern industrial hubs.
Global Benchmarks: Structural Labor Discrepancies
India’s geographic wage spread reflects historical dynamics observed in both advanced and upper-middle-income global economies.
-
The Tier-1 Comparison (USA & Germany): In the United States, the gap between the federal minimum wage ($7.25) and top state rates (such as Washington or California at over $16.00) approaches a 2.2x spread, mediated by liquid capital markets and nationwide federal transfer systems. Germany, through three decades of targeted post-reunification solidarity pacts (Solidarpakt I & II), compressed its West-East wage disparity to under 1.2x.
-
The Tier-2 Comparison (China & Mexico): China navigated this disparity via its Hukou household registration system and heavy targeted capital infusions into interior hubs (e.g., Chengdu, Chongqing), lifting interior wages to within 45-55% of coastal centers like Shanghai and Shenzhen. Mexico’s Northern Border Free Zone (Zona Libre de la Frontera Norte) doubled regional minimum wages relative to the southern interior to stem migration outflows.
The “So What?” Factor: Capital, Corporate Balance Sheets, and Purchasing Power
Economic indicators drive market behavior. When wage floors fluctuate across state lines, they trigger distinct real-world market adaptations:
-
For the Common Household: A family in Bihar (₹519) earning a daily wage must dedicate up to 68% of daily income to basic caloric and fuel requirements, leaving zero headroom for human capital upgrades. In Karnataka (₹1,269), the same caloric basket consumes approximately 28% of baseline income, creating discretionary space for consumer durables, private tutoring, and micro-savings.
-
For Private Corporates and OEMs: Labor-intensive manufacturing enterprises face a structural trade-off. They can either absorb high wage bills in the south and west (₹1,100 – ₹1,270) to access mature supply chains and reliable power, or establish operations in low-wage eastern hubs (₹500 – ₹750) while pricing in logistics bottlenecks, lower labor output, and local governance friction.
-
For Institutional Investors: Real estate developers, private equity funds, and FMCG groups encounter divergent consumer demand patterns. The top-tier wage states generate sustained retail consumption and housing credit uptake, whereas low-wage states remain reliant on low-ticket transactional volumes and unorganized credit.
Comparative Matrix: High vs Low Wage Ecosystems
(Golden Opportunity): High wage differentials incentivize low-cost automated manufacturing units and regional logistics hubs to relocate to Tier-2 and Tier-3 cities across Uttar Pradesh, Odisha, and Madhya Pradesh, where wage-to-productivity ratios remain globally competitive.
Seasonality, Structural Spikes, and Distortions
Reported wage levels carry seasonal variances that must be parsed from permanent macroeconomic trends:
-
The Construction and Post-Harvest Surge: High daily wages across northern states like Punjab (₹962) and Haryana (₹1,154) experience temporary 15% to 20% seasonal spikes during peak harvesting windows (Rabi and Kharif) and pre-monsoon infrastructure execution cycles.
-
Fiscal Spending Acceleration: Wage spikes recorded in frontier territories, including strategic projects in Ladakh (₹481) and Arunachal Pradesh (₹615), reflect direct state-funded defense border allocations rather than organic local private market clearing rates.
-
Urban Center Inflation Distortion: Delhi’s ₹1,346 wage rate accounts for statutory enforcement drives alongside high administrative living expenses, meaning real purchasing power parity (PPP) closely tracks industrial zones in Gujarat (₹1,077) and Tamil Nadu (₹1,115) once shelter and transit overheads are factored in.
The Alternative Scenario: The Equalization Shock
Consider a counter-narrative: what happens if a uniform national minimum wage floor of ₹1,000 per day is enacted nationwide overnight?
An immediate statutory wage doubling in states like Bihar (₹519) or Nagaland (₹538) would destabilize informal enterprise balance sheets. Without corresponding gains in worker output, physical logistics, and grid power reliability, small enterprises would either scale back formal payrolls or transition entirely into the unorganized cash economy. Equalizing wages requires foundational infrastructure and capital access, not administrative decree alone.
Two-Sided Risk Assessment: Bull vs Bear Case
The Bull Case
-
Decentralized Industrialization: The ₹500 to ₹800 wage bands across Uttar Pradesh, Madhya Pradesh, and Odisha, paired with nationwide freight corridors, attract global supply chain relocations away from saturated Tier-1 markets.
-
Demographic Dividend Realization: Sustained productivity-linked wage expansion in the central corridor elevates millions into the formal tax net, expanding domestic consumption to power intermediate manufacturing.
The Bear Case
-
The Low-Skill Trap: Low-wage states remain constrained by capital starvation and educational deficits, functioning solely as raw labor suppliers to wealthier coastal belts.
-
Fiscal Drag and Regional Friction: Persistent economic polarization deepens regional disparities, straining municipal infrastructure in destination cities while limiting revenue generation in migrant-exporting states.
My Verdict: Vision 2030–2047
India cannot realize its Vision 2047 goal of a developed, high-income economy on the back of an unintegrated and starkly divided wage structure. Reaching high-income status requires base labor productivity to rise consistently across all regional markets.
-
The 2030 Horizon: State governments must replace arbitrary minimum wage revisions with Productivity-Linked Wage Baselines. Industrial policies in low-wage states must focus on industrial clusters, stable power supplies, and vocational programs to raise the economic floor.
-
The 2047 Trajectory: India must compress its top-to-bottom wage ratio from 2.91x down to under 1.60x, mirroring structural shifts achieved in economies like Germany and South Korea. Real economic strength stems from raising median purchasing power, not celebrating a mathematical average that obscures underlying disparities.
GOOGLE ‘PEOPLE ALSO ASK’ FAQs
Q1: What is the average daily wage rate in India?
A: ₹1,077 per day is the national average, but regional values range from ₹462 in Lakshadweep to ₹1,346 in Delhi. This marks a 2.91x income gap that separates northern and eastern states from high-income southern hubs.
Q2: Which Indian states offer the highest and lowest daily wages?
A: Delhi leads with ₹1,346, followed by Karnataka at ₹1,269 and Maharashtra at ₹1,231. Conversely, Lakshadweep (₹462), Ladakh (₹481), and Bihar (₹519) record the lowest baseline labor compensations nationwide.
Q3: Why is there a 159% wage disparity between Delhi and Bihar?
A: ₹1,346 in Delhi reflects concentrated industrial capital, organized tech ecosystems, and high urban living costs. Bihar’s ₹519 baseline results from heavy subsistence agriculture, low private capex inflows, and high informal labor saturation.
Q4: How does India’s wage gap compare to global benchmarks?
A: 2.91x is India’s top-to-bottom regional wage ratio, exceeding China’s 2.15x coastal-to-inland gap and the US 2.21x spread. By comparison, Germany compressed its regional parity to 1.18x through structured economic convergence pacts.
Q5: Can implementing a uniform national minimum wage fix the wage gap?
A: A ₹1,000 uniform floor would trigger an immediate 92.6% wage spike in low-wage states like Bihar, threatening MSME margins. Without matching gains in industrial power and labor productivity, arbitrary wage mandates risk driving businesses into the informal cash economy.
Data Verification & Attribution
- Data inputs synthesized from official Labor Bureau releases
- state statutory minimum wage revisions
- Trading Economics data series
Disclaimer: This report is for informational and analytical purposes only and does not constitute formal financial, investment, or policy advice.