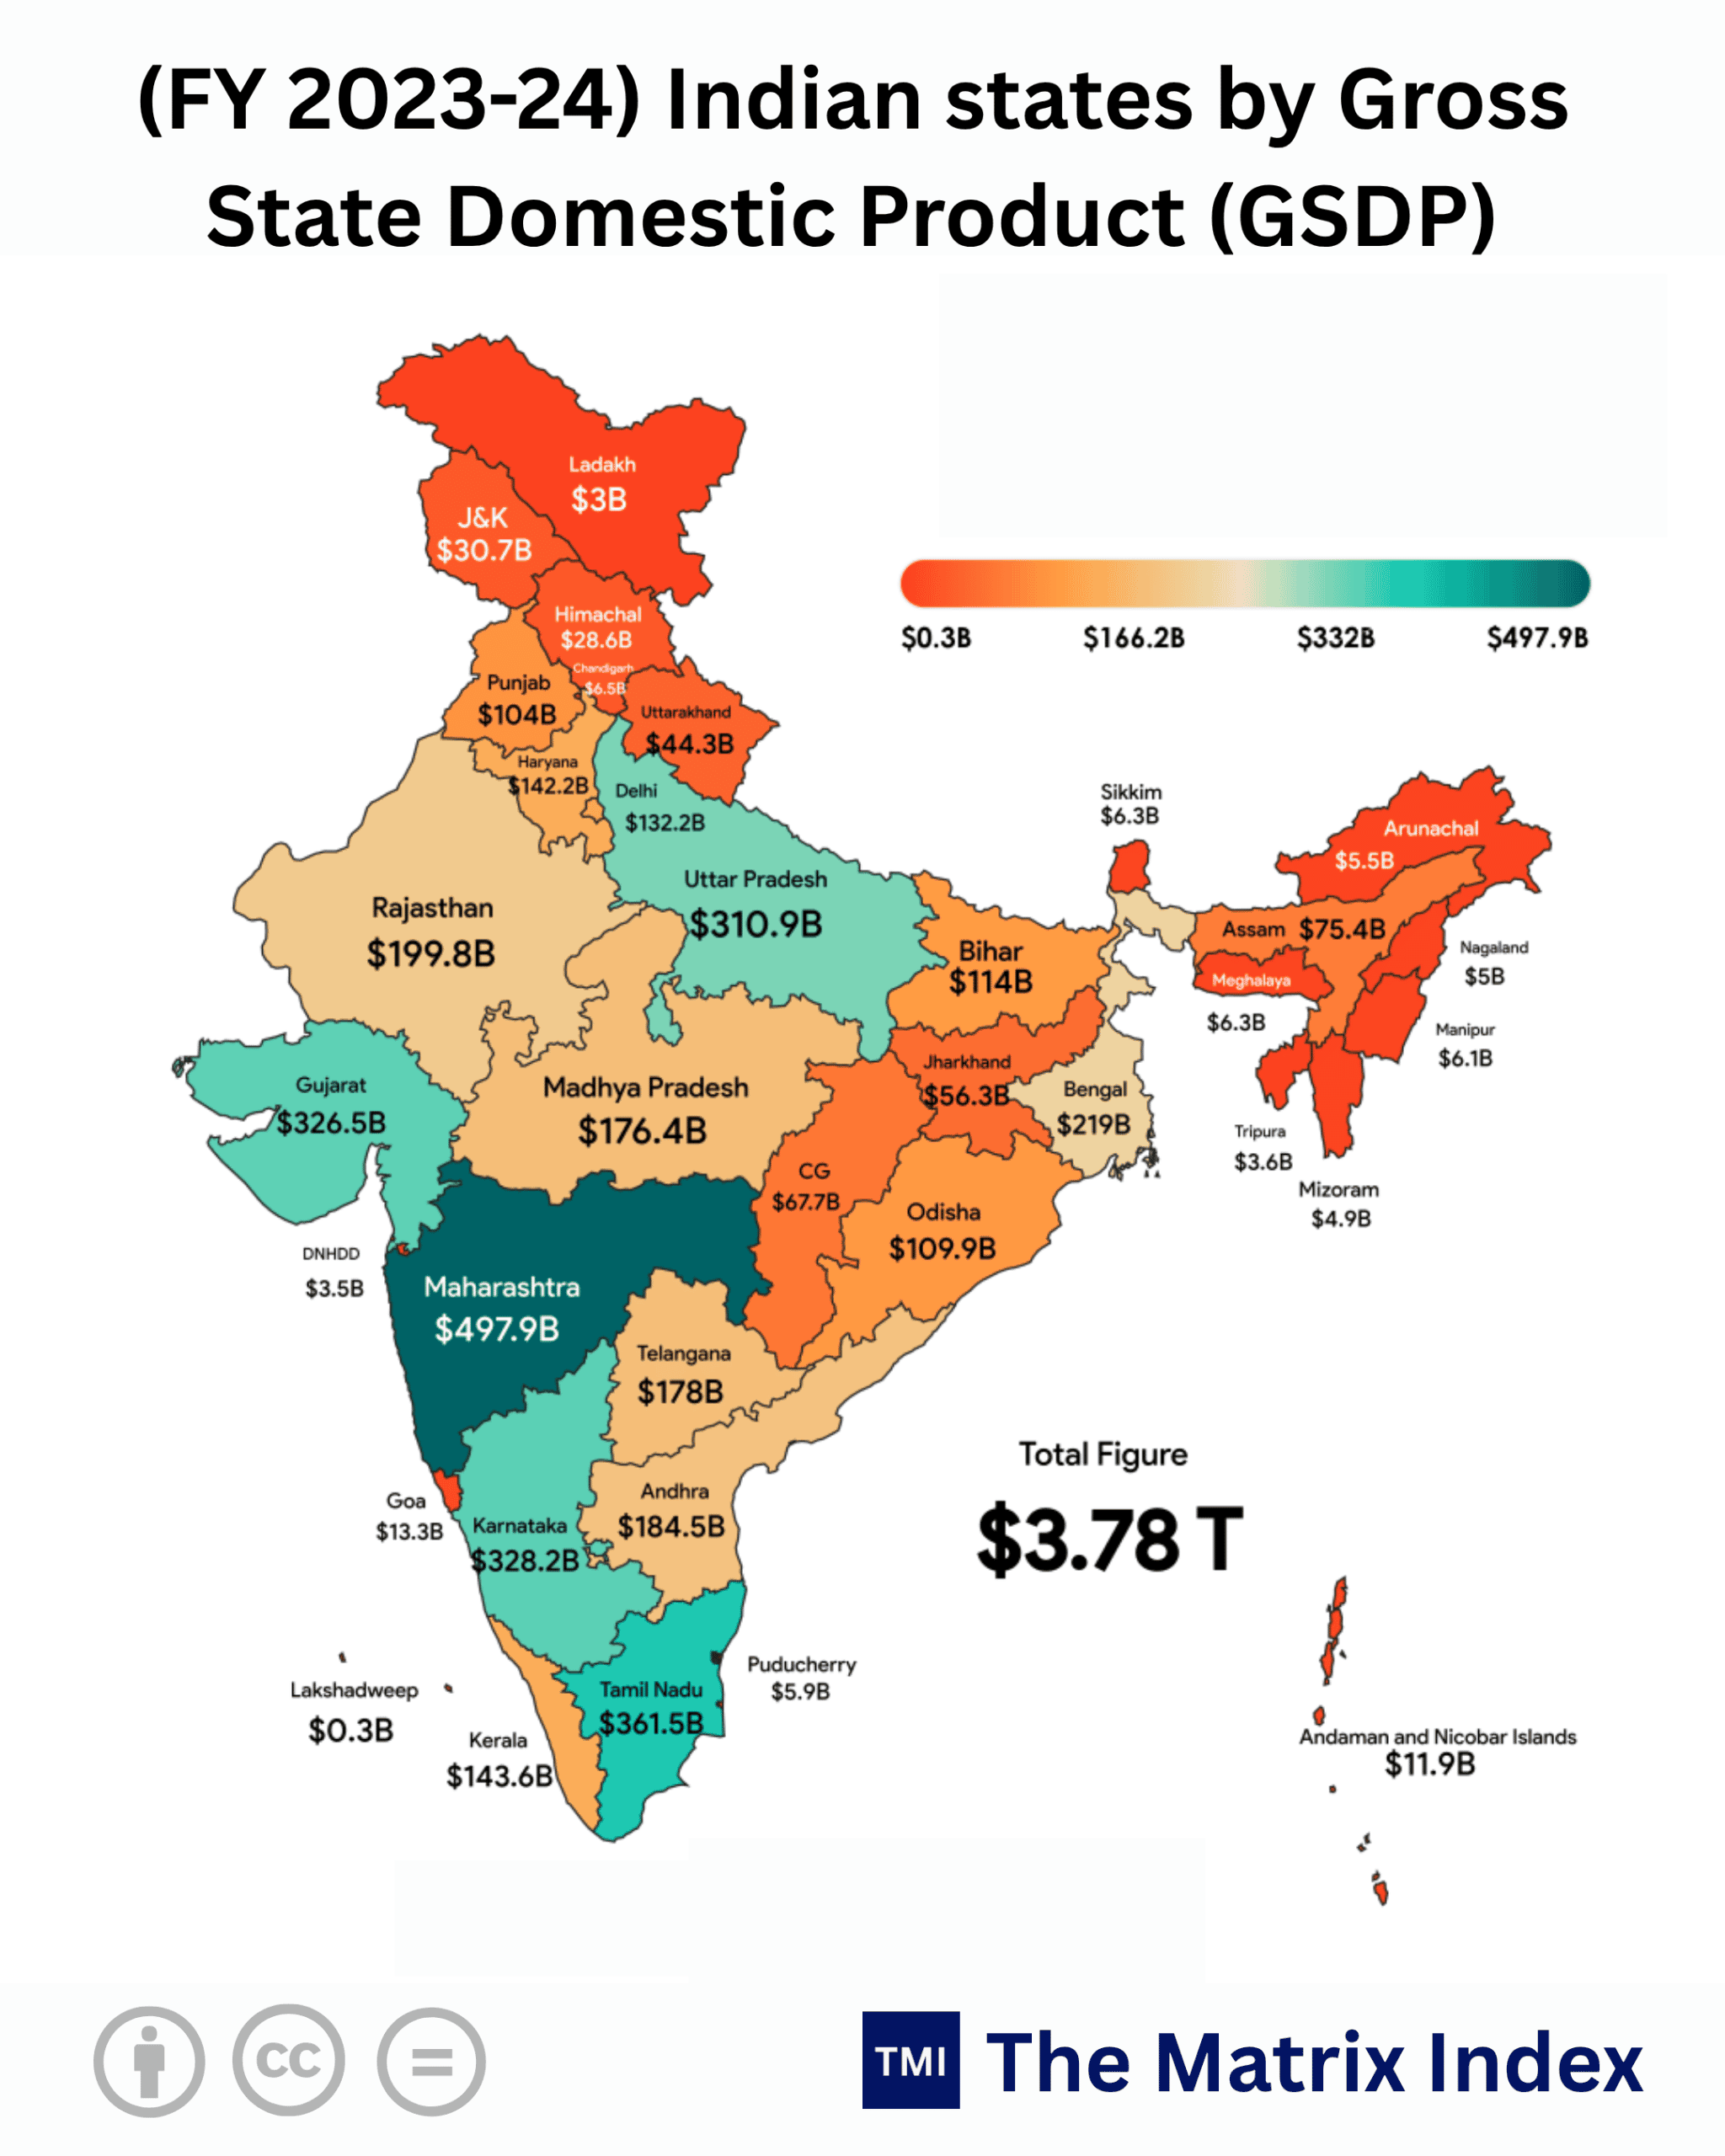
Total Figure: $3.78 T
NEW DELHI, India — Look past the victory laps inside the air-conditioned boardrooms of Bandra-Kurla Complex and the North Block corridors; India’s celebrated $3.78 Trillion national output is not a monolith of collective prosperity, but an uneven economic federation fractured along sharp geographic, structural, and institutional fault lines. When you dismantle the aggregate headline figures, the arithmetic reveals a severe internal divergence. Just 5 states Maharashtra, Tamil Nadu, Karnataka, Gujarat, and Uttar Pradesh command $1.825 Trillion, generating more than 48.2% of the entire country’s Gross State Domestic Product (GSDP). Meanwhile, the bottom 15 states and union territories combine to deliver barely $74.7 Billion, or under 2% of aggregate output.
This isn’t merely regional disparity. It is two distinct economic models coexisting under one currency and central bank.
Consider this: Maharashtra’s $497.9 Billion economy is on the cusp of crossing half a trillion dollars, rivaling sovereign economies like Belgium ($630 Billion), Sweden ($590 Billion), and comfortably eclipsing Norway ($485 Billion) or Austria ($515 Billion). Yet just a thousand kilometers east, Bihar, with a teeming population topping 130 million, manages a modest $114 Billion in annual economic generation. This is an economy equivalent to roughly $870 per capita sitting uncomfortably close to Sub-Saharan baseline benchmarks.
The question isn’t whether the aggregate $3.78 Trillion headline is genuine. It is. The critical question for investors, policymakers, and global supply chains is far more urgent: Can a continent-sized economy run indefinitely on four regional engines while half its population remains locked in low-productivity subsistence?
Anatomy of the Trillion-Dollar Divergence
Economic development rarely spreads evenly across vast geographies, but the sheer steepness of India’s internal economic gradient carries profound macro consequences. As the adage goes: “A chain is only as strong as its weakest link.” By relying on hyper-concentrated clusters, India risks over-leveraging a handful of urban corridors while underutilizing vast reserves of young labor.
The divergence between the coastal-industrial belt and the inland-agrarian interior mirrors historical shifts seen during early twentieth-century American industrialization or China’s Deng Xiaoping-era coastal special economic zones. But there is a vital distinction: India lacks China’s iron-fisted state machinery to direct mass labor relocations or execute instant inland capital deployments.
Let’s dissect the numbers systematically. The western powerhouse duo of Maharashtra ($497.9 Billion) and Gujarat ($326.5 Billion) represents $824.4 Billion over 21.8% of the national total. Anchor this against the southern high-tech and industrial engines of Tamil Nadu ($361.5 Billion) and Karnataka ($328.2 Billion), which provide another $689.7 Billion or 18.2%. Combine these four states, and you account for $1.514 Trillion roughly 40% of total Indian output generated across just four administrations.
Now place this against international benchmarks:
(Golden Opportunity): High-yield global capital can bypass broad sovereign debt and directly target distinct state-level industrial ecosystems tailored to specific value chains.
Granular Tier Breakdown: The Concentrated Hierarchy
To understand where risk sits and where growth compounds, we must organize all 36 administrative territories by their structural weight. The concentration isn’t gradual; it steps down steeply.
Tier 1: The Foundational Giants (Above $300 Billion)
The engines of scale. Each of these five states commands an output capable of altering national macroeconomic trajectories.
-
Maharashtra ($497.9B): The undeniable core of domestic corporate banking, private equity, debt origination, and logistics. It carries Mumbai’s capital markets and the Pune-Aurangabad manufacturing spine.
-
Tamil Nadu ($361.5B): India’s most structurally diversified manufacturing engine. From automotive factories near Chennai to textile clusters in Coimbatore and Tirupur, its model balances urbanization, human development indicators, and broad industrial capacity.
-
Karnataka ($328.2B): The digital export machine. Driven by Bengaluru’s tech services, venture capital ecosystems, and aerospace engineering, its revenues remain tightly coupled with corporate tech budgets in North America and Western Europe.
-
Gujarat ($326.5B): The capital-expenditure champion. Characterized by expansive private port infrastructure, world-scale petrochemical complexes in Jamnagar and Dahej, renewable energy capacity, and diamond processing.
-
Uttar Pradesh ($310.9B): The wild card. Breaking away from low-growth tropes, this populous inland state has transformed its economic profile through expressway corridors, electronics manufacturing along the Noida expressway, and aggressive central capex absorption.
Tier 2: The Secondary Locomotives ($140B to $220B)
The regional pillars holding domestic retail velocity and industrial supply chains together.
-
West Bengal ($219.0B): Driven by services, light trade, agriculture, and high consumer density, though historically challenged in attracting blue-chip capital-intensive greenfield projects.
-
Rajasthan ($199.8B): Transitioning toward renewable energy (solar utility scale), mining, logistics along the Delhi-Mumbai Industrial Corridor, and textiles.
-
Andhra Pradesh ($184.5B) & Telangana ($178.0B): Combined, the Telugu states represent a massive $362.5 Billion bloc. Telangana operates as a hyper-focused life sciences, pharmaceutical, and technology cluster in Hyderabad. Andhra Pradesh leverages a sprawling 974 km coastline, aquaculture, agriculture, and expanding port-led bulk infrastructure.
-
Madhya Pradesh ($176.4B): The central agricultural champion, sustaining long runs of double-digit primary sector growth through aggressive rural electrification and irrigation networks.
-
Kerala ($143.6B): A unique consumer-driven model supported by international remittances, tourism, and services, though constrained in heavy industrial expansion by high land-acquisition costs and labor rigidities.
-
Haryana ($142.2B): High per-capita output driven by the Gurugram finance-and-technology hub alongside high-yield agricultural yields in its northern belts.
Tier 3: The Consumer Base & Resource Belt ($40B to $140B)
Crucial providers of minerals, agricultural bulk, raw energy, and domestic consumer volume.
-
Delhi ($132.2B): A concentrated urban-services and consumption powerhouse with high per-capita spending power.
-
Bihar ($114.0B): A high-population consumer base sustaining corporate fast-moving consumer goods and consumer discretionary demand via inbound worker remittances, yet constrained by a thin formal manufacturing footprint.
-
Odisha ($109.9B): The mining and metallurgical capital of India, attracting heavy investments in steel, aluminum, and port facilities.
-
Punjab ($104.0B): The historic breadbasket, encountering institutional caps on agricultural productivity alongside an urgent need to diversify into high-value manufacturing and software services.
-
Assam ($75.4B): The economic gateway to the Northeast, reliant on oil exploration, tea, and cross-border commercial links.
-
Chhattisgarh ($67.7B) & Jharkhand ($56.3B): Strategic mineral-and-energy supply hubs carrying heavy corporate balances in power, coal, and steel, yet navigating challenging human development metrics.
-
Uttarakhand ($44.3B): High-density pharmaceutical and light industrial zones in the plains (Haridwar-Pantnagar), balanced by eco-tourism across its upper Himalayan terrain.
Tier 4: The Strategic Frontier (Below $40B)
Territories offering high strategic security value, tourism, border trade infrastructure, and unique resource access.
-
Jammu & Kashmir ($30.7B) & Himachal Pradesh ($28.6B): Mountain economies driven by horticulture, hydro-electric generation, infrastructure buildouts, and tourism.
-
Goa ($13.3B): High per-capita tourism, pharmaceuticals, and port logistics.
-
Andaman & Nicobar Islands ($11.9B): The emerging maritime outpost at the mouth of the Malacca Strait, pivoting toward global transshipment.
-
Sikkim ($6.3B), Meghalaya ($6.3B), Manipur ($6.1B), Arunachal Pradesh ($5.5B), Nagaland ($5.0B), Mizoram ($4.9B), and Tripura ($3.6B): Border-trade transit zones supported by substantial central infrastructure programs and strategic logistical networks.
-
Union Territories (Puducherry $5.9B, Chandigarh $4.6B, DNHDD $3.5B, Ladakh $3.0B, Lakshadweep $0.3B): Specialized administrative enclaves ranging from high per-capita urban centers (Chandigarh) to specialized coastal manufacturing territories (DNHDD) and high-altitude security borders (Ladakh).
The “So What?” Factor: What This Means for Portfolios, Margins, and Families
Dry macroeconomic figures mean little until they collide with the everyday balance sheets of households and enterprises. When output clusters within a narrow tier of states, its effects ripple through real estate prices, wage structures, corporate supply networks, and the cost of capital.
The Everyday Household
Consider a working family in Patna versus one in Coimbatore. In Tamil Nadu, industrialized supply chains generate formal manufacturing jobs that offer steady entry wages and social security benefits. In Bihar, the lack of large-scale manufacturing keeps formal wage growth constrained. As a result, working-age earners often travel to industrial clusters in Maharashtra, Gujarat, or Karnataka, sending remittances home to sustain baseline consumption.
Meanwhile, within rapid-growth metros like Bengaluru, Pune, and Hyderabad, households encounter skyrocketing housing costs, traffic congestion, and competition for education and public amenities.
The Institutional Investor
If you are allocating institutional capital, you cannot treat India as a single market. Allocating capital into consumer goods, logistics, or industrial real estate requires evaluating states on individual risk-return profiles.
Private equity investments avoid states lacking reliable power tariffs, port access, or transparent land acquisition mechanisms. Consequently, private capital flows disproportionately into Karnataka, Maharashtra, and Tamil Nadu, while inland states lean heavily on sovereign debt programs, central tax devolutions, and multilateral development loans.
Corporate Supply Chains
Manufacturing operations in inland states face structural logistics premiums. Transporting container freight from factories in Madhya Pradesh or Uttar Pradesh down to ports like Nhava Sheva or Mundra adds time and cost compared to facilities based in Gujarat or Tamil Nadu.
To compete, inland operations must offset these transport premiums through lower labor and land acquisition costs a dynamic that can depress local wages unless balanced by high-efficiency multi-modal freight corridors.
Seasonality and Anomaly Alert: Structural Reality or Short-Term Distortions?
A key question when analyzing this data: Are the rapid growth rates across secondary states genuine structural improvements, or simply post-pandemic base-effect rebounds?
The Structural Shift: Infrastructure Integration
The growth observed across Uttar Pradesh ($310.9B) and Gujarat ($326.5B) reflects multi-year structural capital expenditure rather than temporary fiscal surges. The commissioning of the Western and Eastern Dedicated Freight Corridors (WDFC & EDFC) has begun cutting freight transit times between northern manufacturing clusters and western ports from days to hours.
Similarly, the electronics manufacturing footprint across the Noida-Greater Noida belt has grown from simple assembly operations into deeper component fabrication, supported by the central government’s Production-Linked Incentive (PLI) schemes.
The Anomaly: Fragile State Utility Finances
Beneath these output numbers, several state balance sheets carry notable fiscal vulnerabilities. In Punjab ($104B) and Rajasthan ($199.8B), a meaningful portion of economic activity remains tied to debt-financed agricultural power subsidies and populist revenue spending.
When regional electricity distribution companies (DISCOMs) run high structural losses, headline GSDP growth can mask underlying balance-sheet stress. These practices lean on short-term market borrowing rather than sustainable, productive capital formation.
Bull vs. Bear Case: India’s Sub-National Trajectory
The Bull Case: Decentralized Industrial Integration
-
The Thesis: The infrastructure corridor buildout spanning the PM Gati Shakti master plan, expressways, and coastal industrial zones successfully closes the productivity gap between coastal and inland states.
-
The Mechanism: Rising land and labor costs across Maharashtra, Tamil Nadu, and Karnataka naturally push basic manufacturing into Uttar Pradesh, Madhya Pradesh, Odisha, and Bihar. Simultaneously, coastal and southern hubs migrate up the value chain into semiconductor fabrication, advanced aerospace, software R&D, and biotechnology.
-
The Outcome: The primary and secondary engines fire together. The bottom fifteen states double their collective output within seven years, moving national GDP toward $7 Trillion by 2030 and laying a solid foundation for the $10 Trillion milestone by 2035.
The Bear Case: The Asymmetric Growth Trap
-
The Thesis: Industrial manufacturing remains stubbornly concentrated in five coastal states, while inland economies stay trapped in low-productivity agriculture and public subsidy programs.
-
The Mechanism: Port advantages, dense industrial ecosystems, and deep talent pools keep Tier-1 global firms clustered exclusively in Gujarat, Maharashtra, and Tamil Nadu. High corporate power tariffs, land acquisition disputes, and bureaucratic hurdles continue to slow private capital deployment into interior regions.
-
The Outcome: The northern and eastern interior becomes an economic bottleneck, relying on central tax transfers financed by the south and west. This dynamic heightens regional fiscal debates surrounding Finance Commission tax devolution quotas, keeping real national GDP growth contained in a modest 5.5% to 6.2% range.
Alternative Scenario: What if Policy Priorities Shift?
Consider an alternative scenario: What if international trade shocks, shifts in global trade alignments, or domestic fiscal realignments disrupt standard growth models?
If western trade barriers or protectionist measures dampen growth across coastal, export-oriented hubs, capital allocators will need to pivot toward domestic consumer demand. Under this scenario, businesses would look toward high-density consumer markets in Uttar Pradesh ($310.9B), West Bengal ($219.0B), and Bihar ($114.0B).
To hedge against disruptions at critical maritime ports like Nhava Sheva or Mundra, domestic manufacturers will need to establish redundant warehousing and processing hubs through inland container depots (ICDs) spread across central India.
Strategic Outlook and the Road to 2047
Looking ahead toward the national milestones of 2030 and the centenary of independence in 2047, India’s economic journey will not be decided solely by central policy declarations in New Delhi. It will be determined on the factory floors of Sriperumbudur, across the petrochemical installations of Jamnagar, through the tech parks of Whitefield, and within the emerging logistics corridors of the Gangetic Plain.
To secure a durable spot as the world’s third-largest economy, India must bridge its internal development divides. Relying primarily on Maharashtra, Tamil Nadu, Karnataka, and Gujarat to generate forty percent of the country’s economic momentum leaves the broader system vulnerable.
True economic scale requires that the talent and population of Uttar Pradesh, Bihar, Madhya Pradesh, and Odisha transition from passive consumer markets into productive industrial and technological contributors.
Capital allocators, multinational corporations, and domestic industry leaders should position their balance sheets around this sub-national transition:
-
Move Past Single-Country Assumptions: Approach the Indian market with the same regional nuance you would apply to the European Union or the continental United States. Build distinct supply chains and market-entry strategies for coastal-export corridors versus inland consumer-volume markets.
-
Track State Capex Schedules: Follow state-level capital expenditure budgets closely. The states that allocate funds toward logistics, reliable power distribution, and clear land titles will outpace their regional peers, generating solid long-term returns for private capital.
-
Anticipate Supply Chain Decentralization: Take advantage of the expanding expressways and Dedicated Freight Corridors. Moving production facilities away from congested coastal metropolitan hubs into cost-competitive Tier-2 and Tier-3 urban centers can optimize operating margins over the coming decade.
The underlying numbers confirm the scale of India’s long-term opportunity, but unlocking its full potential depends on balancing the ledger between its industrial engines and its populous interior.
GOOGLE ‘PEOPLE ALSO ASK’ FAQS
Q1: Which Indian states generate the largest share of national GDP?
A: $1.825 Trillion, or 48.2% of India’s $3.78 Trillion total output, is generated by just five states: Maharashtra ($497.9B), Tamil Nadu ($361.5B), Karnataka ($328.2B), Gujarat ($326.5B), and Uttar Pradesh ($310.9B). This creates an extreme regional industrial concentration.
Q2: How does Maharashtra’s economy compare to sovereign nations?
A: $497.9 Billion in annual output positions Maharashtra ahead of advanced sovereign nations like Norway ($485B) and Austria ($515B). Driven by financial services and heavy industry, its economy operates on the scale of Tier-1 European trade hubs.
Q3: What is the economic gap between India’s coastal and inland states?
A: 40% of national output is concentrated in four coastal and high-tech states (Maharashtra, Gujarat, Tamil Nadu, Karnataka), totaling $1.514 Trillion. Conversely, inland agrarian regions like Bihar ($114B) struggle with lower per capita output and high remittance dependence.
Q4: What is the primary risk to India’s Vision 2030 economic targets?
A: 5.5% to 6.2% long-term growth traps threaten national targets if low-productivity inland states fail to industrialize. Without decentralized capital investment shifting into secondary corridors, infrastructure and demographic imbalances could restrict progress toward the $7 Trillion by 2030 roadmap.
Q5: How do Dedicated Freight Corridors impact inland manufacturing GSDP?
A: Hours instead of days is the new transit benchmark enabled by the Eastern and Western Dedicated Freight Corridors (EDFC & WDFC). This network connects manufacturing belts in Uttar Pradesh directly to western ports, lowering logistics premiums for inland industrial zones.
Data Source:
- Ministry of Statistics and Programme Implementation (MoSPI)
- Reserve Bank of India (RBI)
- World Bank National Accounts.
Disclaimer: This report is for informational and analytical purposes only and does not constitute formal financial, investment, or policy advice.