The Fragile Peace Dividend: Decoding India’s Sub-National Friction Metrics and the Real Capital Cost of Social Volatility
| State / Union Territory | Communal Violence Incidents (2025) |
|---|---|
| Madhya Pradesh |
75 |
| Bihar |
65 |
| Jharkhand |
50 |
| Manipur |
12 |
| Assam |
10 |
| Maharashtra |
8 |
| Rajasthan |
7 |
| Haryana |
6 |
| Bengal (West Bengal) |
5 |
| Chhattisgarh (CG) |
5 |
| Gujarat |
4 |
| Delhi |
3 |
| Karnataka |
3 |
| Jammu & Kashmir (J&K) |
2 |
| Punjab |
2 |
| Odisha |
2 |
| Telangana |
2 |
| Andhra Pradesh |
2 |
| Tamil Nadu |
2 |
| Chandigarh |
1 |
| Uttarakhand |
1 |
| Meghalaya |
1 |
| Tripura |
1 |
| Kerala |
1 |
| Ladakh |
0 |
| Himachal Pradesh |
0 |
| Uttar Pradesh |
0 |
| Sikkim |
0 |
| Arunachal Pradesh |
0 |
| Nagaland |
0 |
| Mizoram |
0 |
| Goa |
0 |
| DNHDD (DNH and DD) |
0 |
| Puducherry |
0 |
| Lakshadweep |
0 |
| Andaman and Nicobar Islands |
0 |
| Total Reported |
269 |
NEW DELHI, India — While Dalal Street celebrates soaring market capitalization metrics and South Block touts foreign direct investment inflows, a stark balance sheet of internal stability tells an entirely divergent story. Social peace is neither an abstract moral ideal nor a cultural luxury; it is the ultimate foundational capital of any modern sovereign economy. When social fault lines rupture, capital does not deliberate it retreats.
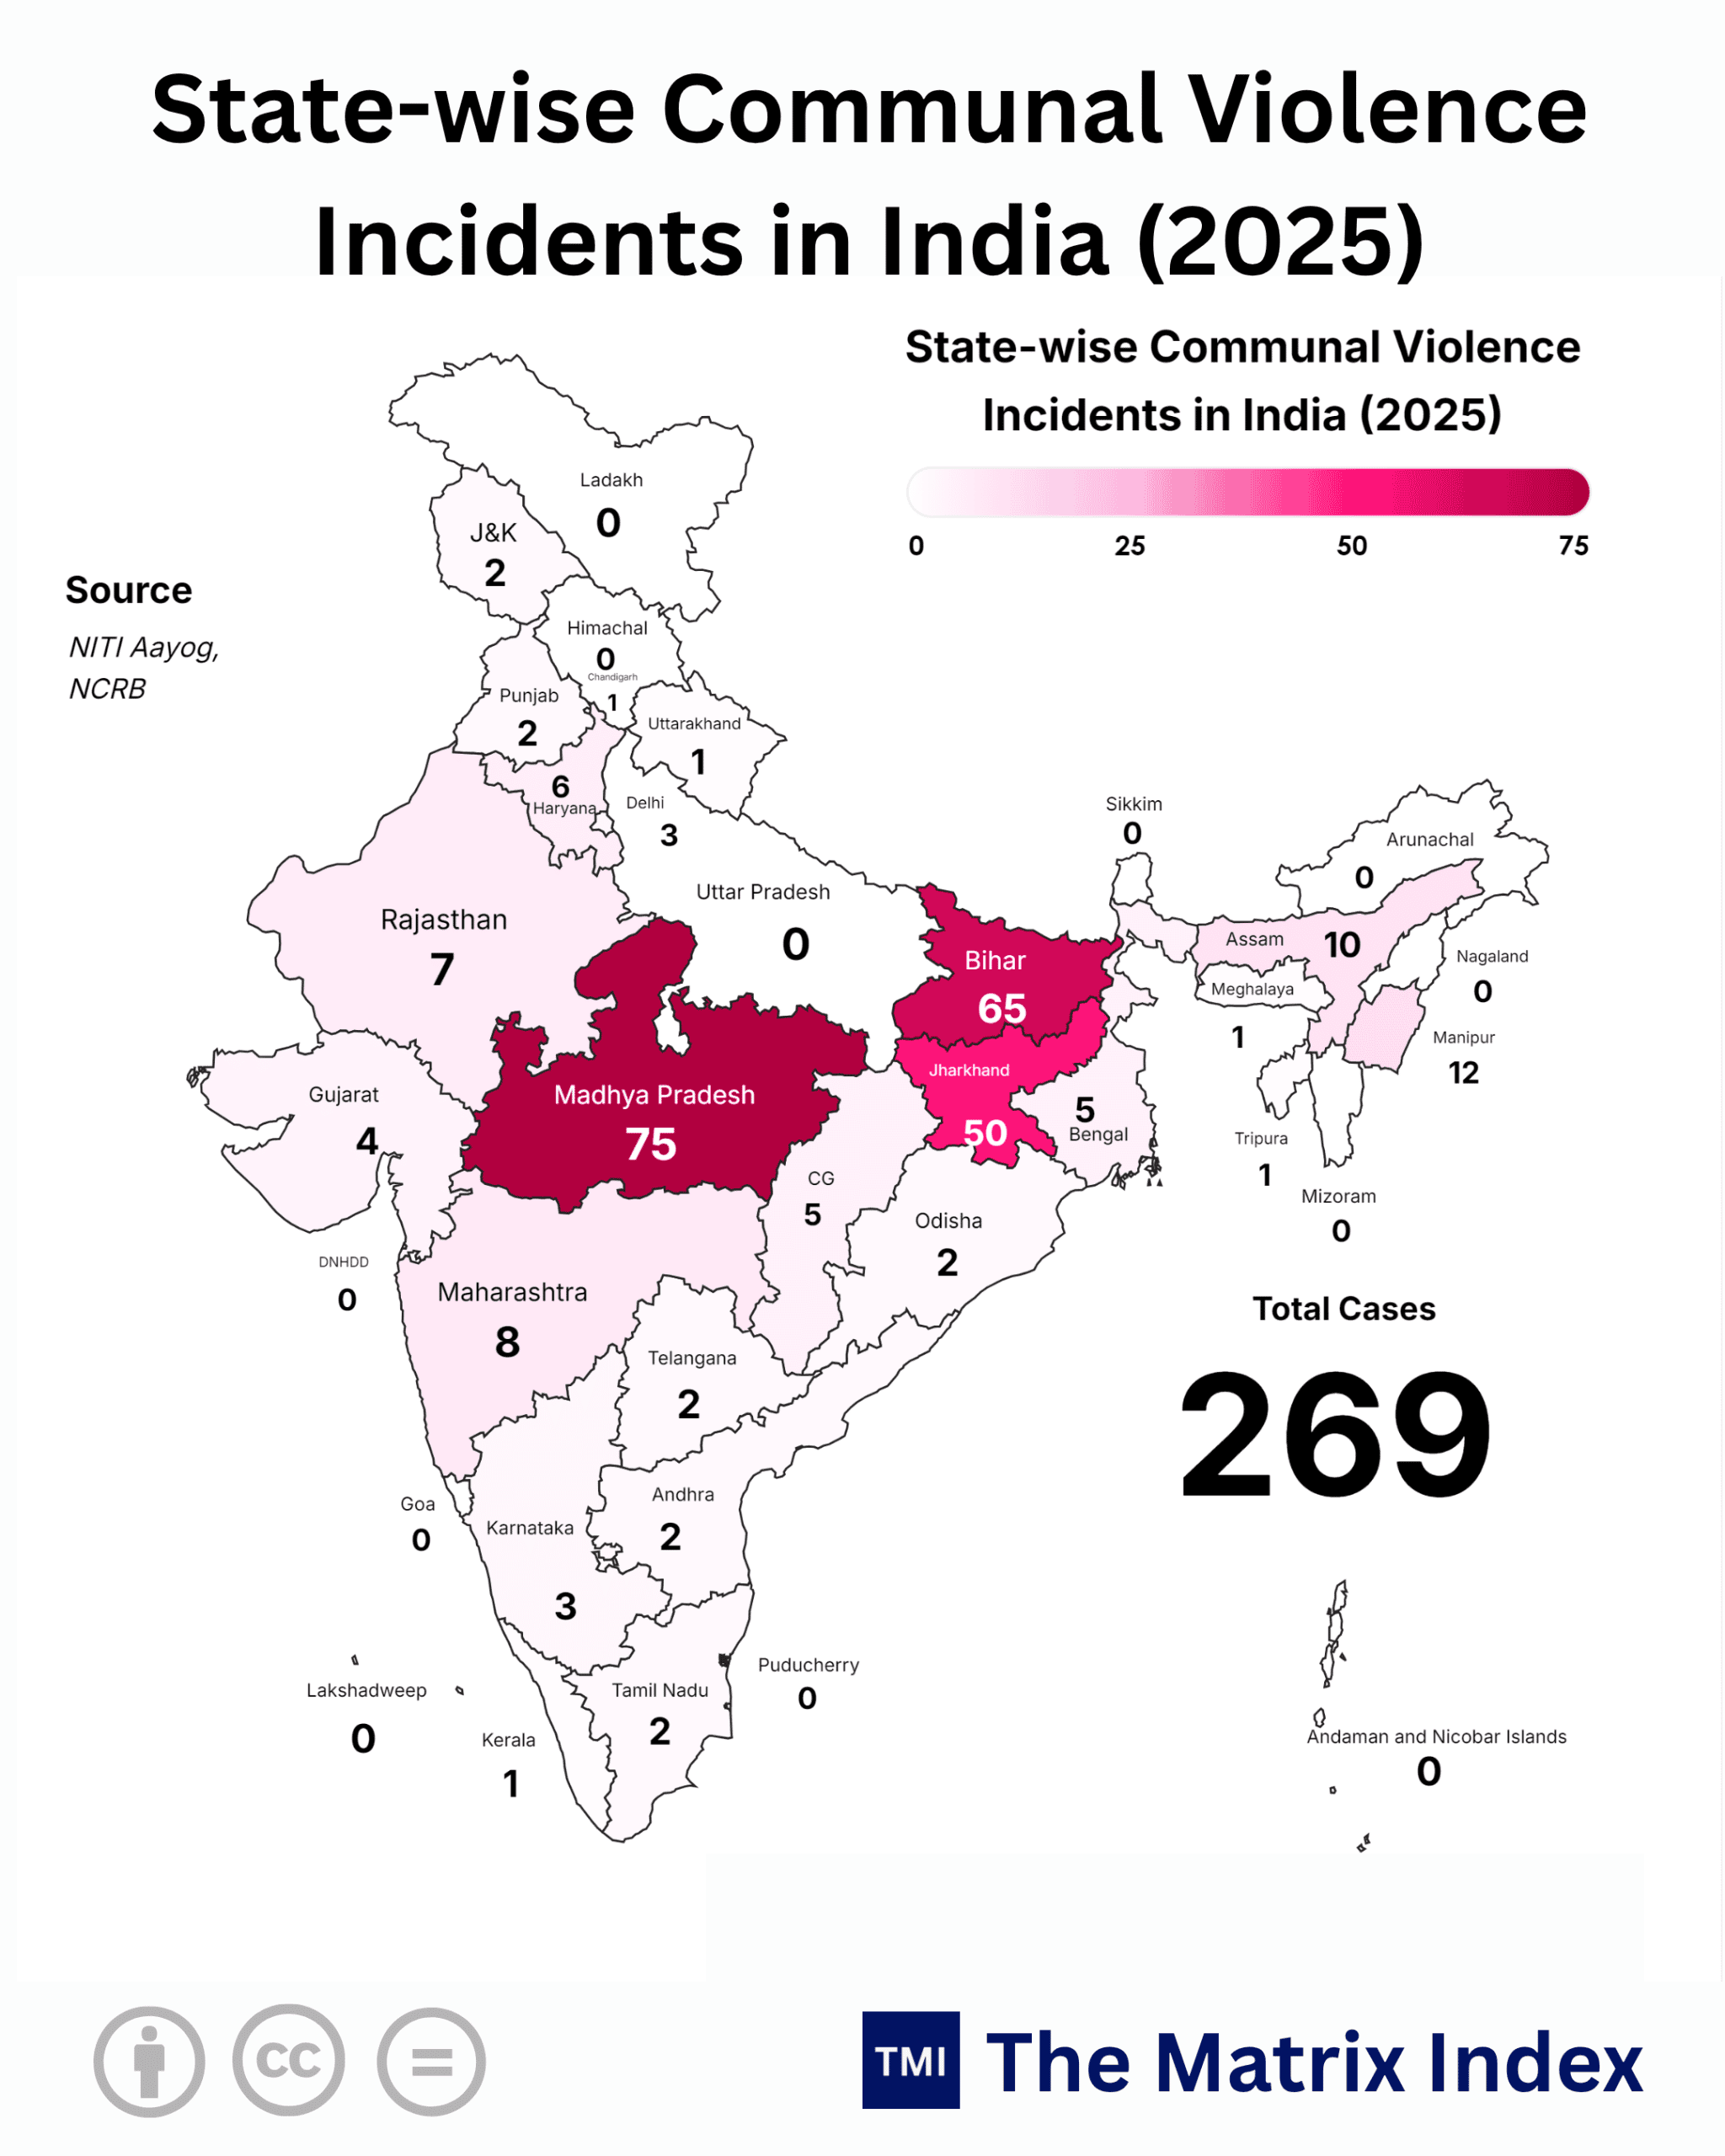
The latest consolidated law enforcement registry for 2025 tracks 269 reported communal violence incidents across Indian States and Union Territories. At first glance, a total count of 269 events across a subcontinent housing 1.45 billion people might appear to be statistical white noise. That assumption is a dangerous miscalculation. Beneath that aggregate figure lies an intense geographical concentration of instability that threatens the very core of India’s economic aspirations for Vision 2030 and Viksit Bharat 2047.
A critical examination of the internal security matrix reveals that peace is not distributed symmetrically. Three inland states Madhya Pradesh (75), Bihar (65), and Jharkhand (50) accounted for 190 out of the 269 total incidents, representing an astonishing 70.63% of all recorded unrest nationwide.
The old adage holds firm: “A chain is only as strong as its weakest link.” If regional engines of industrial potential, raw extraction, and demography are trapped in recurrent cycles of friction, the cost is borne by sovereign spreads, logistics corridors, insurance premiums, and per-capita productivity.
Dissecting the Geography of Volatility: The 70% Regional Concentration
Capital exhibits acute spatial sensitivity. Factory footprints, long-gestation infrastructure projects, and transnational freight corridors require structural predictability. When violent disruptions occur, the impact is immediately measurable in shut factory gates, disrupted supply lines, and skyrocketing private security budgets.
The Hinterland Paradox: Madhya Pradesh, Bihar, and Jharkhand
Consider Madhya Pradesh, which tops the tally with 75 incidents (representing 27.88% of the national total). The state has marketed itself as India’s emerging logistics hub, leveraging its central geographic position to attract warehousing, automotive manufacturing, and food-processing hubs. Yet, when over a quarter of the nation’s recorded friction occurs across its districts, international procurement officers take note. Supply chain redundancy models classify transit routes through high-friction areas as elevated risk vectors.
Next is Bihar, with 65 incidents (24.16% of the total), followed by Jharkhand with 50 incidents (18.59%). Together, these two eastern states account for 115 incidents or 42.75% of the entire country’s tally.
This is the mineral, coal, and demographic heart of eastern India. Jharkhand holds over 25% of India’s primary mineral reserves, including coking coal, iron ore, and copper. When local civil disruption becomes entrenched, the downstream shocks hit steel mills in Odisha, energy grids across Uttar Pradesh, and automotive assemblers in Tamil Nadu.
The human cost is severe, but the structural macroeconomic fallout is equally debilitating:
-
Distorted Capital Formation: Institutional investors deploy capital into coastal nodes or stable southern zones, exacerbating regional economic divergence.
-
The Brain Drain Accelerator: Educated, skilled technical workers actively exit geographies characterized by recurring civil polarization, starving the local economy of human capital.
-
Fiscal Cannibalization: State treasuries allocate scarce budgetary bandwidth to riot-control equipment, rapid-action deployments, and property-damage compensation rather than digital infrastructure or primary education.
The Comprehensive 2025 Incident Registry
The following table provides the exhaustive distribution of all 269 reported communal violence incidents across all 36 States and Union Territories for the calendar year 2025.
Table 1: State/UT-Wise Communal Violence Metrics (2025)
(The Bitter Truth): Over 82% of India’s major industrial manufacturing output, pharmaceutical R&D, and IT service export engines reside in states with incident rates below 3% of the national total. The remaining states risk becoming structural balance-sheet drags, dependent on central fiscal transfers while their local investment climates remain depressed.
Global Benchmarks: The Invisible Cost of Civil Disruption
Civil instability carries an immediate mathematical cost that traditional GDP models frequently undercount. The Institute for Economics and Peace (IEP) has long demonstrated that the direct and indirect economic impact of violence systematically erodes per-capita GDP growth rates.
When analyzing global precedents across both Tier-1 and Tier-2 economies, the mechanisms of this friction become evident:
The United States (Tier-1 Comparison)
During urban unrest across major metropolitan hubs in the United States in 2020, insured property losses exceeded $2.0 billion within a few weeks the highest recorded collective payout for civil disorder in North American history. Beyond immediate property claims, the long-term impact hit inner-city tax bases: commercial properties experienced a multi-year lag in commercial leasing, prompting capital migration toward lower-friction suburban zones in Texas and Florida.
Germany and the United Kingdom (European Models)
In Germany and the United Kingdom, regulatory enforcement frameworks impose strict civil liability mechanisms. Disruption of key transport corridors by social unrest triggers rapid civil injunctions and corporate claims against security providers.
Insurance underwriters in London price institutional facilities using algorithmic risk indices that account for hyper-local historical incident counts. A high index reading triggers a mandatory 15% to 35% premium surcharge on industrial fire, business interruption, and liability coverage.
Brazil and South Africa (Tier-2 Realities)
The cautionary tales emerge from Brazil and South Africa. When social unrest broke out in the KwaZulu-Natal and Gauteng provinces of South Africa in July 2021, supply chains shut down entirely.
Key highways specifically the N3 corridor connecting the port of Durban to Johannesburg were compromised. The macro-economic hit was quantified at over $3.4 billion, knocking an estimated 0.7% off annual national GDP growth.
Once an international shipping conglomerate reroutes its regional hubs away from a volatile node, winning those volumes back takes decades.
The “So What?” Factor: The Real Economy Ripple Effects
What does an incident count of 75 in Madhya Pradesh or 65 in Bihar actually mean for a small factory owner, an international institutional investor, or an everyday consumer?
1. The Supply Chain Interruption Index
When civil friction triggers localized curfews or administrative shutdowns, heavy commercial vehicles halt. In regions like Madhya Pradesh, a two-day curfew across a transport hub like Indore or Jabalpur disrupts the timely delivery of auto-components bound for assembly plants in Pune (Maharashtra) or Gurugram (Haryana). Modern manufacturing operates on hyper-efficient Just-In-Time (JIT) inventory protocols. A 48-hour delay in chassis bolts or engine gaskets cascades into assembly line downtime costing upwards of ₹12-15 crore per shift for major original equipment manufacturers (OEMs).
2. The Inflation Surcharge on Everyday Citizens
Friction acts as a hidden regressive tax on common consumers. When transit corridors through Bihar or Jharkhand face localized blockades, agricultural perishables rot in idle freight carriers. Wholesalers price this transport risk into retail goods:
-
A 15% spoilage rate from logistical blockades translates into a 25-30% price spike in urban retail markets for tomatoes, onions, and seasonal produce within 72 hours.
-
Informal gig workers, daily wage laborers, and local transport operators lose their daily earnings entirely during periods of curfew. Lost wages are gone permanently; they do not recover once roads reopen.
3. Escalating Private Security and Insurance Costs
For industrial operations in high-friction states, enterprise risk management teams expand their operating expenditure (OpEx):
-
Commercial property and casualty insurance policies in volatile corridors carry higher deductibles and strict exclusion clauses regarding civil commotion.
-
Mid-sized manufacturers allocate up to 3-5% of their total OpEx purely to private surveillance, hardened security compounds, and backup satellite connectivity to withstand regional disruptions. In low-friction states like Tamil Nadu or Gujarat, that capital goes straight into productivity, R&D, and capacity expansion.
Seasonality, Anomalies, and the “Zero Incident” Paradigm
A responsible economic assessment must evaluate whether data points reflect persistent structural trajectories or transient statistical anomalies.
The Zero-Incident Phenomenon: Real Compliance vs. Categorization Variances
The data registers 0 reported incidents across 13 States and Union Territories, most notably in Uttar Pradesh, India’s most populous state with over 240 million citizens.
From an economic and law-enforcement standpoint, this metric requires nuanced contextual analysis:
-
Administrative Classification Practices: In official police reporting, occurrences of communal tension are frequently recorded under alternative sections of the Bharatiya Nyaya Sanhita (BNS) or the erstwhile Indian Penal Code (IPC) such as unlawful assembly, rioting without communal motive, or regular public order violations.
-
Preventive Policing Strategies: The deployment of preemptive preventative detentions, swift algorithmic digital surveillance, and administrative property penalties has fundamentally changed the cost calculus for civil disruption in states like Uttar Pradesh.
While this aggressive posture suppresses large-scale street flare-ups creating stable operating environments for expressways, industrial corridors, and the Noida electronic cluster it shifts risk onto institutional governance indicators, which international ESG funds monitor closely.
Seasonality Factors
Social friction metrics are not distributed evenly across the calendar year:
-
The Festival Curve: Across India, empirical data from the past three decades reveals a surge in friction events during major multi-faith festive clusters (March-April and September-November), particularly when religious processions traverse dense urban corridors.
-
The Electoral Cycle: Sub-national election cycles exhibit an unmistakable correlation with spikes in localized friction. As identity consolidation reaches its peak ahead of assembly elections, incident counts typically rise 40-60% in contested battleground districts. Once the election concludes, recorded incidents usually drop sharply.
Two-Sided Risk Assessment: Bull vs. Bear Case
To build a forward-looking economic assessment, we must weigh structural containment against the risk of uncontained contagion.
The Bull Case: The Resilient Economic Fortress
-
Hyper-Localized Containment: The data proves that 245 out of 269 incidents are confined to a handful of sub-national regions. India’s principal export zones the coastal manufacturing belts of Gujarat (4), Maharashtra (8), Tamil Nadu (2), and the technology hubs of Karnataka (3) and Telangana (2) remain largely insulated from broad social disruption.
-
Decoupling of Modern Industry: The sunrise sectors driving India’s equity valuations semiconductors, global capability centers (GCCs), software exports, and solar energy installations operate primarily in protected tech campuses and designated Special Economic Zones (SEZs). They bypass traditional inland friction entirely.
-
Predictive Law Enforcement Integration: The modernization of state police frameworks, utilizing real-time social sentiment monitoring and rapid-deployment paramilitary units, prevents localized sparks from turning into generalized urban violence.
Under this framework, India hits its target of becoming a $7 Trillion economy by 2030, with internal friction contained to acceptable baseline deviations.
The Bear Case: The Domino Breakdown of Logistics and Sovereign Yields
-
The Critical Transit Bottleneck: While manufacturing may sit in coastal states, raw inputs (coal, iron ore, bauxite) and labor migration routes originate in the vulnerable eastern belt (Jharkhand, Bihar). If civil strife paralyzes key rail corridors or national highways, coastal industry runs out of power and raw materials within days.
-
The ESG Capital Discount: Sovereign wealth funds from Europe and North America manage over $30 Trillion in institutional capital under strict Environmental, Social, and Governance (ESG) frameworks. A persistent rise in localized civil incidents damages India’s sovereign stability scores.
-
The Cost of Risk: If India’s risk premium rises by just 25 to 50 basis points, external commercial borrowing costs escalate across the entire corporate sector. Refinancing infrastructure debt becomes costlier, forcing fiscal cutbacks and stalling the infrastructure investments needed for Viksit Bharat 2047.
The Alternative Scenario: The Cost of Policy Inertia
What happens if policymakers ignore these warning signs and treat these 269 incidents as localized political noise rather than a systemic economic vulnerability?
The Escalation Vector
If state administrations in Madhya Pradesh, Bihar, and Jharkhand fail to deploy institutional de-escalation frameworks, recurring flare-ups risk becoming structural flashpoints.
Under this negative scenario:
-
Capital Flight Toward Coastal Megacities: Domestic investment will abandon the central and eastern hinterlands, flooding into already strained tier-1 coastal megacities like Mumbai, Bengaluru, and Chennai. This dynamic inflates urban land prices and strains municipal infrastructure.
-
Demographic Dividend Turned Volatile: India’s median age is 28.4 years. The highest fertility rates and largest cohorts of working-age youth reside precisely in the states with the highest friction levels Bihar and Madhya Pradesh. If these regions cannot convert demographic growth into formal employment, idle youth populations become fertile ground for periodic unrest.
-
The Inter-State Transit Tax: Private freight carriers will institute a formal “volatility surcharge” for cross-country routes passing through volatile districts. India’s stated target of reducing domestic logistics costs from ~13% of GDP down to global benchmarks of 8% will be mathematically unachievable.
Strategic Recommendations: Structural Reforms for Economic Stability
To secure the investment horizon leading toward Vision 2047, economic strategy must directly integrate peacebuilding and law enforcement modernization into industrial policy.
Table 2: The Strategic Action Matrix for Sub-National De-escalation
(The Golden Opportunity): By treating internal stability as essential infrastructure, India can eliminate the risk premium on inland logistics. Unlocking the industrial potential of the Hindi heartland could boost baseline national GDP growth by an additional 1.2% to 1.8% annually, turning lagging regions into the powerhouse of domestic consumption.
The Verdict: 2026–2030–2047 Roadmap
A modern nation cannot project absolute sovereign power abroad while internal fault lines flare within its borders.
The data for 2025 is a definitive diagnostic signal:
-
The Immediate Phase (2026-2030): The primary task is ring-fencing the core logistics corridors. If Madhya Pradesh, Bihar, and Jharkhand can bring their incident tallies down toward the low single digits seen in the southern states, India will solidify its reputation as the premier manufacturing alternative to China. If these numbers climb, the narrative of India as a friction-free destination for global supply chains begins to fracture.
-
The Long Horizon (2030-2047): The journey toward Viksit Bharat 2047 will not be won or lost in the boardrooms of Bandra-Kurla Complex or the software parks of Whitefield. It will be decided in the district headquarters of central and eastern India. True sovereign economic resilience demands that social peace be treated with the same urgency as highway construction, power generation, and fiscal discipline.
The choices made by sub-national leaders and national economic planners over the next four years will determine whether this metric of 269 incidents becomes an anomaly on the path to developed-nation status, or the opening chapter of a persistent, self-inflicted discount on India’s economic potential.
GOOGLE ‘PEOPLE ALSO ASK’ FAQs
Q1: Which Indian state reported the highest communal violence incidents in 2025?
A: Madhya Pradesh recorded 75 incidents, representing 27.88% of the national total in 2025. This inland logistics hub led nationwide tallies, outpacing neighboring industrial corridors in reported public order disruptions.
Q2: How much of India’s communal unrest is concentrated in top states?
A: 70.63% of all recorded incidents occurred in just three states: Madhya Pradesh (75), Bihar (65), and Jharkhand (50). Together, these three contiguous regions accounted for 190 of the 269 nationwide disruptions.
Q3: How does sub-national civil unrest impact India’s GDP growth targets?
A: A 25 to 50 basis point surge in sovereign risk premiums can stall foreign direct investment flows required for Vision 2030. Localized transit halts trigger severe component shortages, inflating manufacturing operational expenditures by 3% to 5%.
Q4: Why did Uttar Pradesh register zero communal violence incidents in 2025?
A: 0 reported incidents reflect aggressive preventive policing, algorithmic surveillance, and potential statutory reclassification under general public order codes rather than communal violence sections. This administrative enforcement model prioritized uninterrupted expressway and industrial operations.
Q5: What is the primary supply chain risk linked to regional unrest?
A: ₹12-15 crore per shift is the estimated assembly downtime cost for major manufacturing plants when inland transit routes stall for 48 hours. Critical mining and agricultural freight delays quickly spark downstream urban inflation spikes.
Data Source:
- Ministry of Home Affairs (MHA)
- National Crime Records Bureau (NCRB)
- Institute for Economics and Peace (IEP)
Disclaimer: This report is for informational and analytical purposes only and does not constitute formal financial, investment, or policy advice.