NEW DELHI, India — Look closely at the glass on your desk, because that translucent liquid you assume is life-sustaining might just be a slow-acting economic poison pill disguised as hydration. We live in an era of obsessive GDP tracking, yet we fundamentally ignore the literal solvent holding our civilization together, trading our hydrological security for short-term political expediency and corporate complacency.
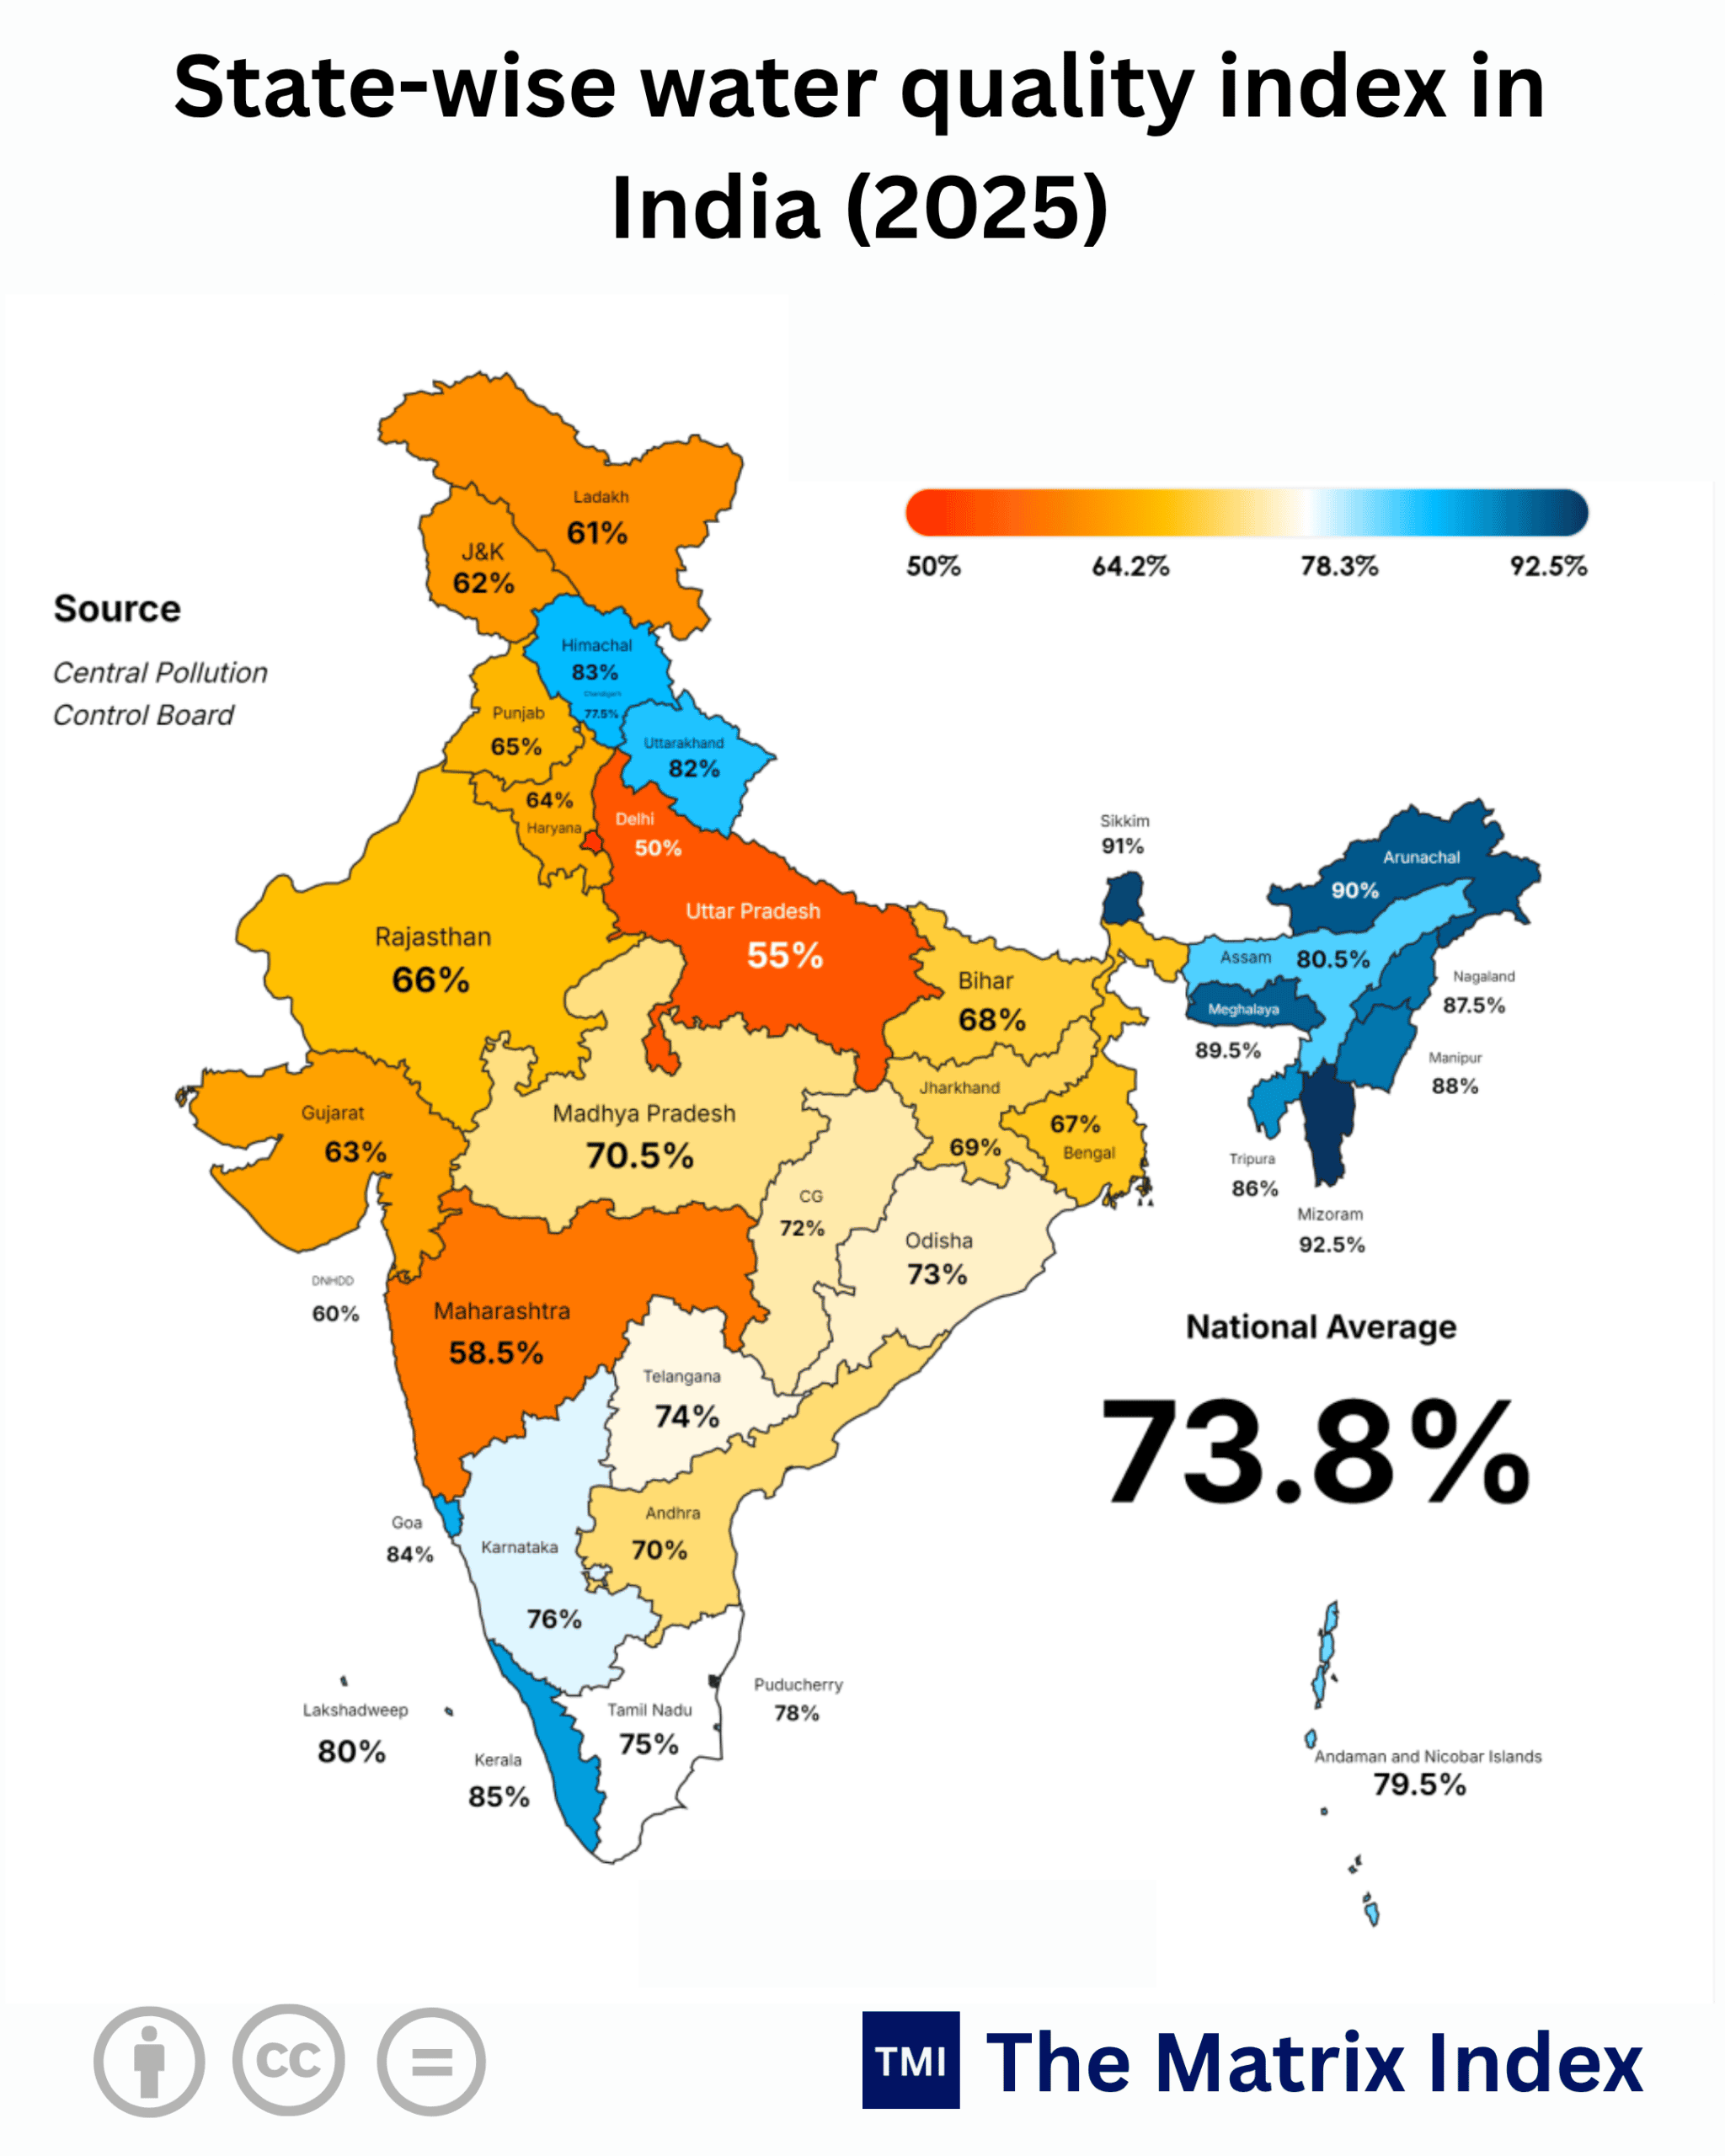
The numbers are out, and they are nothing short of an indictment of our collective sanity, exposing a 2025 Water Quality Index where states like Mizoram sit proudly at 92.5% while industrial and political powerhouses like Delhi drag the national average down to a dismal 50%.
This is not merely an environmental crisis; it is a macro-economic catastrophe waiting to obliterate capital markets, crush labor productivity, and bankrupt healthcare systems from the mountains of the Northeast to the political corridors of the North.
The Great Hydrological Divide: Mapping the Silent Collapse
Economic theory loves to obsess over interest rates, fiscal deficits, and equity multiples, completely ignoring the most basic input function of human capital: clean water. When you look at the 2025 Water Quality Index data across India’s states and union territories, you are not looking at a list of geographical regions; you are looking at a brutal hierarchy of future economic survival.
Mizoram leads the pack at 92.5%, closely flanked by Sikkim at 91%, Arunachal Pradesh at 90%, and Meghalaya at 89.5%. These numbers tell a story of lower population density, better forest cover, and localized watershed management that puts mainland India to shame.
Compare this idyllic picture with the industrial heartlands and demographic giants of the country. Maharashtra crawls at 58.5%, Uttar Pradesh languishes at 55%, and Delhi hits absolute rock bottom at 50%, dragging the National Average down to an alarming 73.8%.
Think about what a 50% water quality index actually means in a megacity of over 30 million people. It means that millions of citizens are consuming heavy metals, untreated sewage, and toxic industrial runoff every single day, turning public health infrastructure into a permanent emergency ward.
When we hold this mirror up to global benchmarks, the picture gets even grimmer. Compare India’s 73.8% national average with top-tier OECD nations like Germany, the UK, and Japan, where potable water compliance routinely hovers above 99%. Even emerging market peers like Brazil and Mexico maintain baseline urban water quality indices well north of 80%.
We are attempting to run a $5 trillion economy on water infrastructure that belongs in the nineteenth century.
The “So What?” Factor: The Brutal Ripple Effect on Markets and Masses
Why should an institutional investor sitting in Mumbai or a tech worker in Bengaluru care about a water index score in Delhi or Uttar Pradesh? Because capital follows labor, and labor cannot produce value when it is chronically ill.
The ripple effect of a 50% water quality index in the national capital or a 55% score in UP hits corporate balance sheets through three devastating vectors: soaring healthcare expenditures, catastrophic absenteeism, and invisible capital destruction. When water-borne diseases cost India over 73 million working days annually amounting to billions of dollars in lost productivity your equity portfolios take a direct hit, even if the companies are completely asset-light.
For the common citizen, this is a daily exercise in quiet desperation. A middle-class family in Gurugram or Noida spends upward of 15% of their monthly discretionary income on commercial RO systems, bottled water, and private tanker deliveries, treating a basic human right as a luxury subscription model.
Meanwhile, small-scale entrepreneurs and daily wage laborers absorb the shock directly in their bloodstream, suffering from chronic kidney ailments and gastrointestinal disorders that permanently destroy their lifetime earning potential.
The market is pricing in corporate earnings growth while ignoring the literal dehydration of the workforce. When clean water becomes scarce, agricultural yields plummet, input costs for food processing skyrocket, and headline inflation becomes structural rather than temporary.
Seasonality and Anomaly Alert: The Illusion of Monsoonal Recovery
Financial analysts love to point at post-monsoon groundwater recharge data as proof of recovery, falling victim to a classic seasonal illusion. A heavy monsoon season in 2024 or 2025 might temporarily spike aquifer levels across states like Punjab (65%) and Haryana (64%), but this is a short-term statistical spike masking a permanent long-term structural decline.
We are treating fossil water aquifers that took millennia to fill like a checking account with no overdraft limit. The anomaly is not that water quality is dropping during peak summer; the anomaly is that we treat year-round ecological degradation as a weather problem rather than a policy failure.
When states like Gujarat (63%) and Rajasthan (66%) report chronically depressed water quality indices, no amount of seasonal rainfall can reverse the deep-seated industrial contamination of their river basins.
The Complete State-Wise Water Quality Index Landscape
To understand the sheer scale of this geographic disparity, examine the complete breakdown of water quality across Indian states and union territories for 2025:
(The Bitter Truth): A national average of 73.8% is not a passing grade for an aspiring global superpower; it is an economic time bomb hidden inside our tap water, waiting to explode on our balance sheets.
Two-Sided Risk Assessment: Bull vs. Bear Case
Navigating the economic future of water requires looking at both the optimistic transformations and the catastrophic failure modes heading our way by 2030.
Bull Case: The Decentralized Technological Renaissance
In the bullish scenario, acute scarcity forces a massive paradigm shift in capital allocation toward water-tech, decentralized recycling, and strict industrial zero-liquid-discharge (ZLD) mandates.
By 2030, government initiatives like the Jal Jeevan Mission, combined with private equity inflows into advanced desalination, IoT-enabled smart metering, and AI-driven river basin management, successfully lift the national average above 85%.
States currently lagging at the bottom such as Delhi (50%) and Uttar Pradesh (55%) aggressively adopt Singapore-style NEWater models, turning sewage treatment plants into high-grade industrial water suppliers.
Capital markets reward early movers in the environmental engineering sector, creating millions of green-collar jobs and stabilizing agricultural productivity across the Indo-Gangetic plain. The transition from linear water consumption to a closed-loop circular economy acts as a major tailwind for national GDP growth, cementing India’s position as a resilient economic titan heading toward its 2047 centenary.
Bear Case: The Hydro-Anarchy Spiral
In the bearish scenario, bureaucratic inertia, rampant corruption, and the relentless expansion of unregulated industrial pollutants push the system past the breaking point.
By 2030, major urban centers like Delhi, Mumbai, and Lucknow face severe day-zero water crises, where municipal taps run completely dry and groundwater tables collapse beyond recovery.
Public health systems buckle under epidemics of water-borne toxins and heavy-metal poisoning, slashing national labor productivity by 4% to 6% annually. Agricultural output in breadbasket states like Punjab (65%) and Haryana (64%) plummets due to severe soil salinization and chemical saturation, triggering food security crises and mass climate migration from rural hinterlands to already overwhelmed urban slums.
Global rating agencies downgrade India’s sovereign debt due to severe environmental vulnerability, triggering massive capital flight and freezing foreign direct investment. The cost of basic survival consumes the savings of the middle class, obliterating domestic consumption and turning the demographic dividend into a demographic nightmare.
The Alternative Scenario: The Hypothetical Counter-Narrative
What happens if the current macroeconomic consensus shatters and global climate shocks accelerate twice as fast as projected? Imagine a scenario where monsoon patterns permanently shift by 2030, reducing average annual rainfall across central and northern India by 30%, while industrial growth continues unchecked.
Under this stress test, existing water policies become instantly obsolete. The government would be forced to trigger emergency rationing protocols, militarize interstate river basins to prevent water wars between states like Karnataka and Tamil Nadu, and implement draconian carbon-style water quotas for all manufacturing sectors.
Corporate entities would no longer have the luxury of voluntary ESG reporting; compliance with stringent water-efficiency standards would become the sole determinant of whether a business entity is granted operating licenses.
Private capital would rapidly pivot away from traditional real estate and heavy manufacturing, funneling exclusively into aquatech, atmospheric water generators, and drought-resistant agricultural biotechnology.
My Verdict: The 2030-2047 Vision and Strategic Action Plan
We stand at a critical historical crossroads where the choices made in the next 36 months will dictate whether India achieves its Vision 2047 developed-nation aspirations or collapses under the weight of its own ecological neglect.
A national water quality index of 73.8% is a national embarrassment that cannot be glossed over with political rhetoric or cosmetic PR campaigns.
To bridge the chasm between Mizoram’s 92.5% benchmark and Delhi’s 50% abyss, economic policymakers must treat water security not as a subsidiary welfare issue, but as the foundational pillar of national security and monetary stability.
The Execution Roadmap
-
Implement Real-Time Mandatory Auditing: Every industrial unit and municipal corporation must be tied to a blockchain-verified real-time water quality and extraction monitor, with automated penalties and immediate shutdowns for non-compliance.
-
Shift Agricultural Subsidies: Dismantle power and fertilizer subsidies that incentivize the cultivation of water-guzzling crops in arid regions, redirecting those fiscal savings directly toward drip irrigation, micro-watershed development, and dry-land farming grants.
-
Institutionalize Zero-Liquid-Discharge (ZLD): Make ZLD mandatory for all heavy industries, thermal power plants, and chemical manufacturing hubs by 2028, transforming wastewater treatment into a profit center through mandatory industrial recycling.
The era of cheap, abundant, and thoughtless water consumption is over. The markets will ruthlessly punish those who fail to adapt, and history will judge us not by the height of our stock market indices, but by the quality of the water we leave for the next generation.
Look at your glass again. The clock is ticking down to 2030, and the hydrological bill is finally coming due.
GOOGLE ‘PEOPLE ALSO ASK’ FAQs
Q1. What is India’s national average water quality index score?
India’s national average water quality index sits at a concerning 73.8%, heavily weighed down by severe industrial contamination and agricultural runoff across densely populated northern and western plains. This widespread degradation threatens both long-term labor productivity and macroeconomic stability.
Q2. Which Indian state has the highest water quality index?
Mizoram leads the national rankings with a pristine water quality index score of 92.5%, closely followed by Sikkim at 91% and Arunachal Pradesh at 90%. These high-performing northeastern regions benefit from superior forest cover and low industrial population density.
Q3. Why is Delhi’s water quality index dangerously low?
Delhi registers the lowest water quality index in the country at a critical 50%, driven by intense urban overdraw, untreated sewage discharge, and heavy industrial effluent load into the Yamuna basin. This structural failure creates acute public health risks and forces heavy household spending on filtration.
Q4. How does water quality impact India’s economic growth?
Water pollution and scarcity cost India billions of dollars annually through lost working days from water-borne illnesses and skyrocketing agricultural input costs. Without aggressive decentralization and strict zero-liquid-discharge mandates, this silent crisis could severely impede the Vision 2047 economic roadmap.
Q5. What are the primary drivers of poor water quality in states like Uttar Pradesh and Maharashtra?
Uttar Pradesh at 55% and Maharashtra at 58.5% suffer from intensive groundwater extraction, heavy chemical fertilizer saturation, and unregulated manufacturing effluent. These systemic vulnerabilities risk triggering severe day-zero water shortages and capital flight if immediate policy interventions fail.
Data Source:
- Central Pollution Control Board (CPCB)
- Ministry of Jal Shakti
- World Health Organization (WHO)
- Water Assessment Metrics
Disclaimer: This report is for informational and analytical purposes only and does not constitute formal financial, investment, or policy advice.