The Great Degree Shakedown: Why Higher Education Is Cannibalizing the Global Middle Class
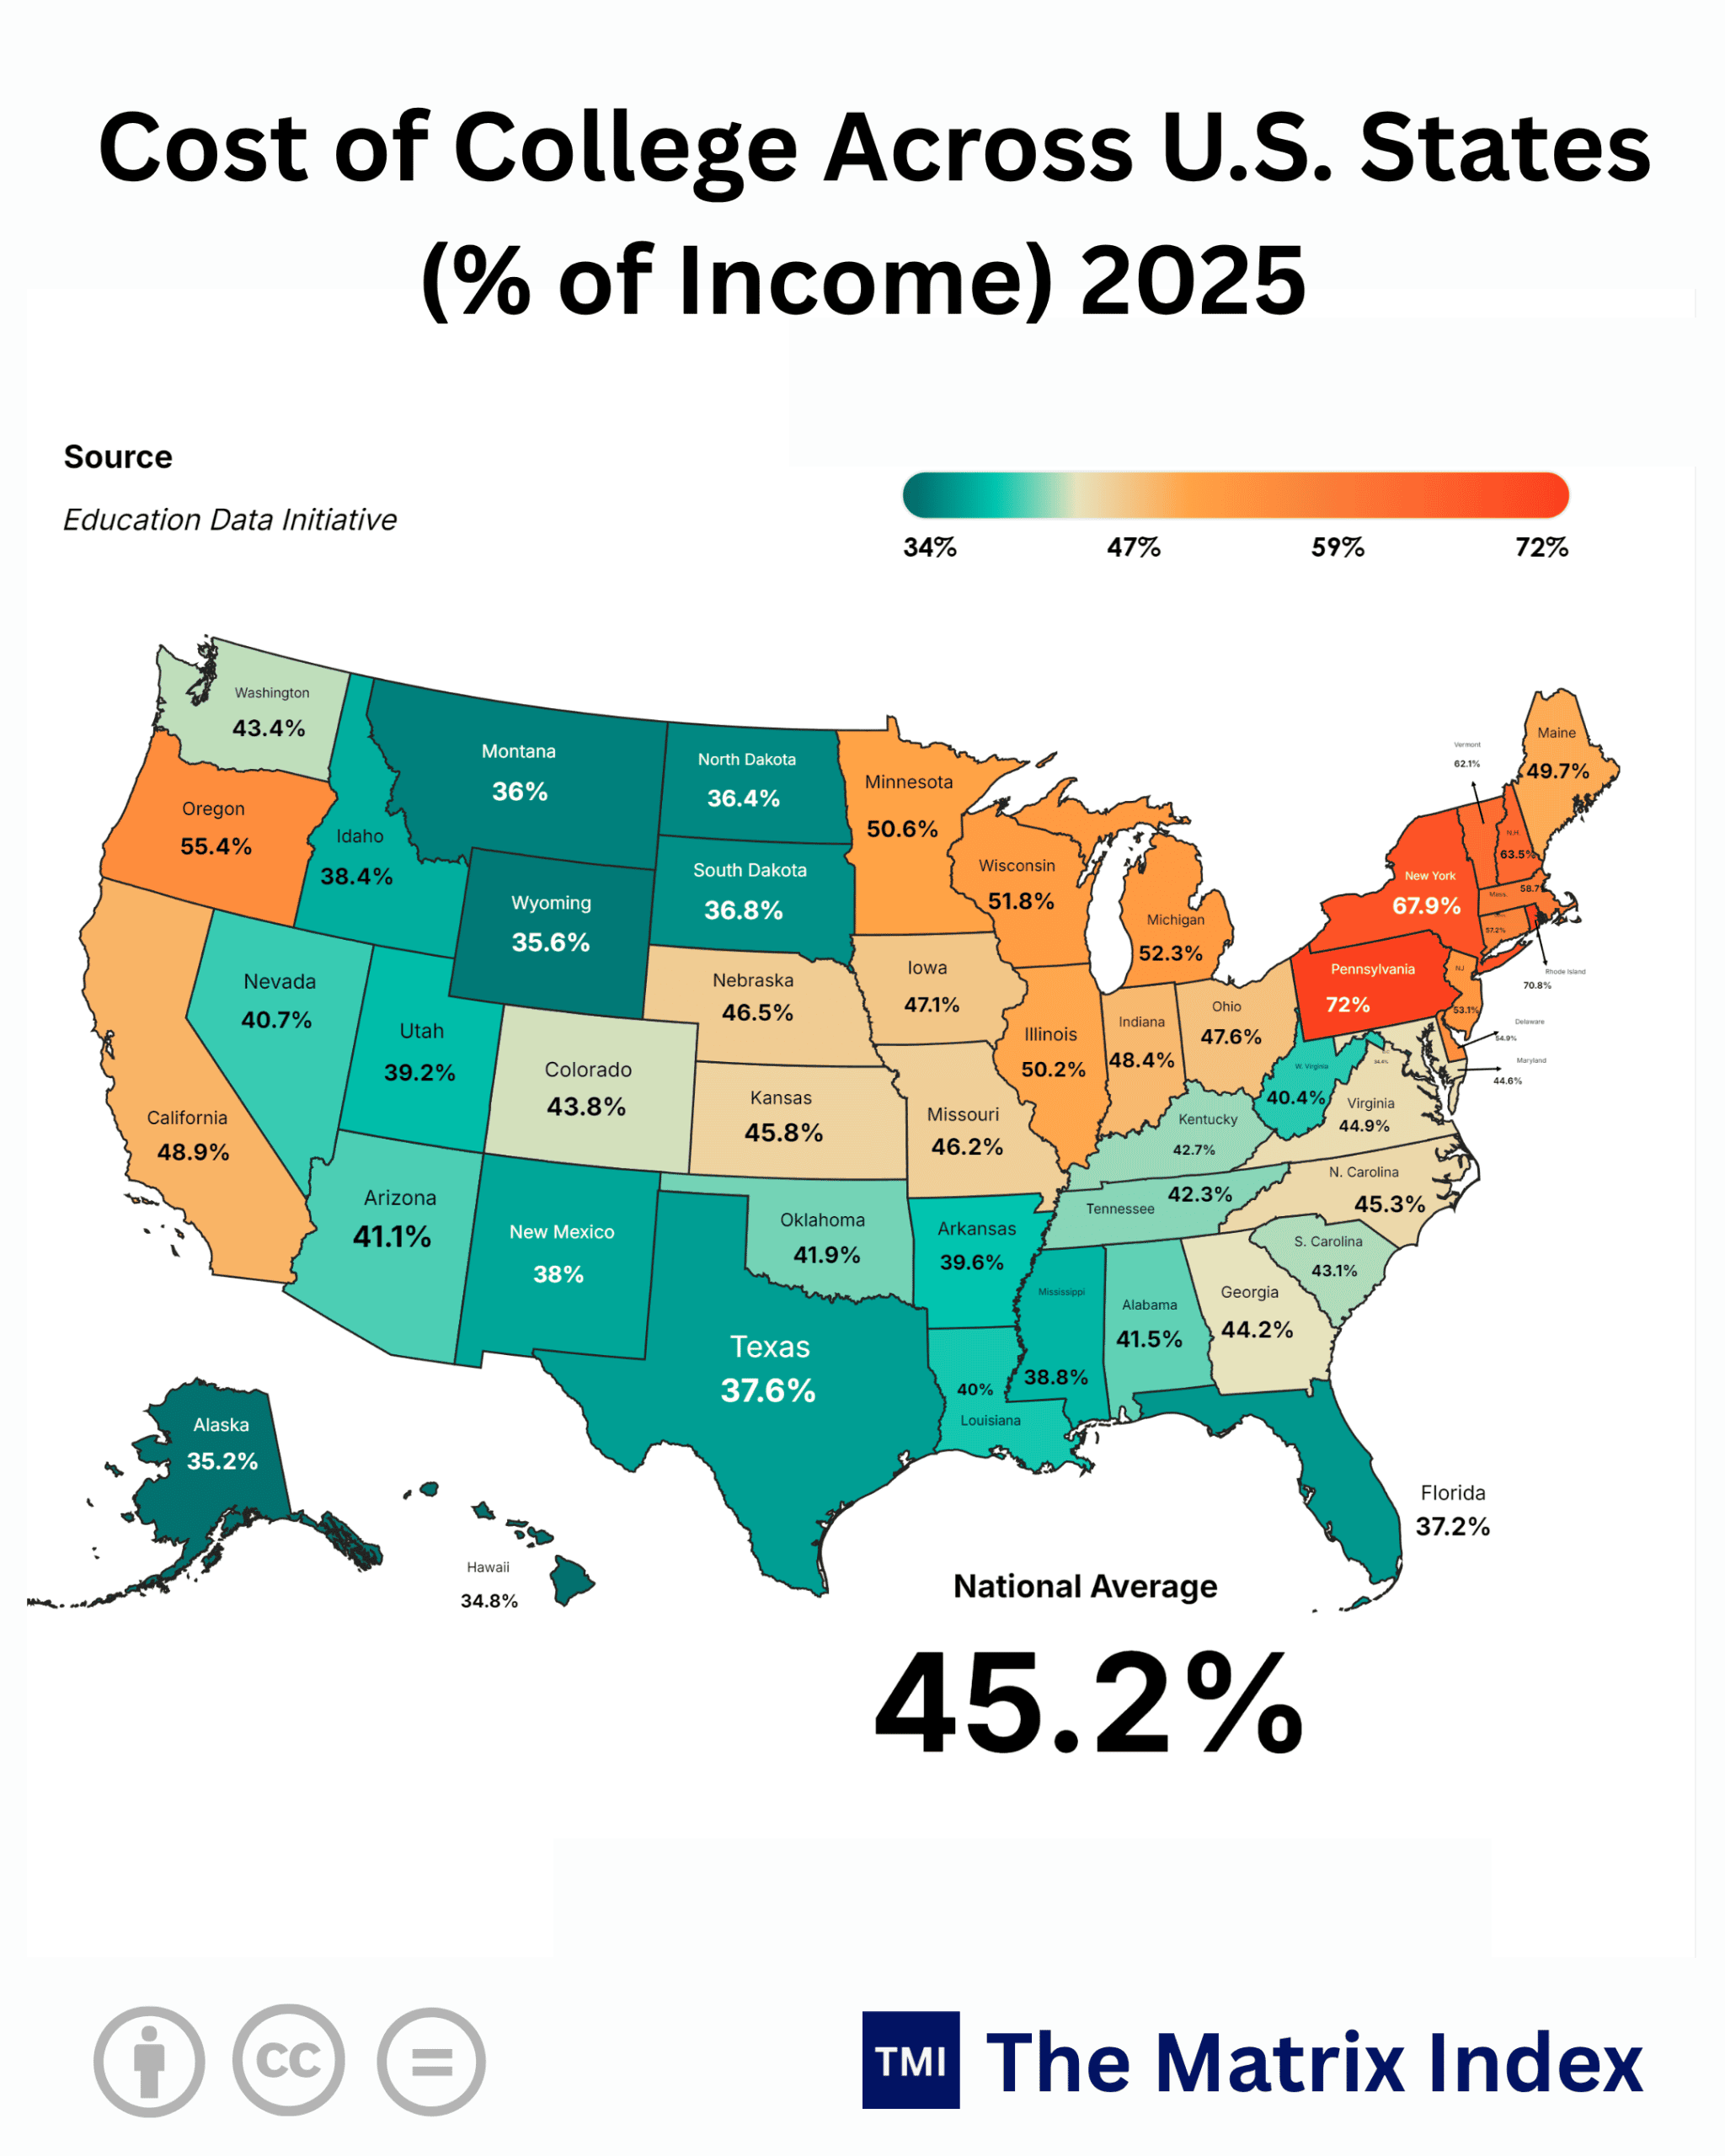
NEW DELHI, India (November 01, 2026 / IST) — American higher education is no longer an engine of upward social mobility; it has metastasized into an extractive, debt-leveraged racket that consumes nearly three-quarters of a working family’s annual earnings in states like Pennsylvania.
Look at the ledger. When a median household is forced to commit 72% of its pre-tax income to put a single child through four years of college, we are no longer discussing human capital formation. We are witnessing structural asset stripping masquerading as pedagogy.
Wall Street calls it an investment. State legislatures call it self-reliance. I call it economic predation.
For four decades, the global middle class was sold a sleek piece of secular theology: trade four years of your youth and an ever-expanding mountain of unsecured debt for a lifetime ticket to financial immunity. That social contract has shredded before our eyes. The bill has come due, and the numbers are ugly.
The Geography of Educational Insolvency
The sheer variance across the United States is staggering. It exposes a fragmented, predatory apparatus where zip codes dictate financial ruin.
Consider Pennsylvania (72%), Rhode Island (70.8%), and New York (67.9%). In these states, sending a child to college is mathematically equivalent to signing over your entire liquid net worth. You eat the principal, mortgage the house to the hilt, and pray the tech sector doesn’t automate your graduate’s prospective entry-level desk job before graduation day.
Even the ostensible “bargains” in the union Hawaii at 34.8%, Alaska at 35.2%, and Wyoming at 35.6% demand more than a third of a family’s gross yearly receipts. Since when did a baseline civilizational requisite command a third of an entire household’s labor?
This is not market efficiency. It is price-fixing enabled by limitless federal liquidity, ballooning administrative bloat, and an institutional refusal to face productivity realities.
The Macroeconomic Ledger: 2025 State-by-State Exposure
The Global Yardstick: American Carnage vs. International Sanity
To understand how perverse this dynamic has become, step outside the American echo chamber. Compare the US National Average of 45.2% against Tier-1 and Tier-2 economic powers.
Take Germany. Under its public framework, undergraduate tuition at public universities is zero. Domestic and international students alike pay a nominal administrative semester fee ranging between €150 and €350 ($160–$380), which typically includes a regional public transit pass. The cost of a degree relative to German median income is negligible under 3%, reflecting solely living expenses. The state treats higher education as public infrastructure, much like highways or the electrical grid.
Look at Australia. Through the Higher Education Contribution Scheme (HECS-HELP), the government sets tuition bands and fronts the cost via income-contingent loans. Australian graduates repay nothing until their post-graduation income clears an indexed threshold (roughly A$54,000 in recent cycles). If a graduate encounters an economic downturn or chooses a low-paying public service career, the repayment rate drops to 0%. Contrast that with the American regime, where non-dischargeable debt compounds through private servicers regardless of whether you are employed or broke.
In Japan, national universities operate under regulated tuition caps set around ¥535,800 ($3,600 to $4,000 annually), keeping the burden under 18% of the median salary. The state does not permit institutions to price-gouge the next generation.
Even in emerging Tier-2 markets like Brazil, the premier institutions the federal and state universities such as the University of São Paulo (USP) are completely tuition-free, funded out of value-added and corporate tax receipts. Entry is competitive through the Vestibular, but families are not driven into bankruptcy for access.
The United States stands alone among advanced economies in treating higher education as an aggressive subprime consumer credit market. By financializing basic credentialing, America has turned what should be an engine of human capital into an anchor dragged across the balance sheets of millions of households.
The Mechanics of Administrative Bloat and Financialization
Why does it cost 72% of an average family’s income to attend college in Pennsylvania? Did the intellectual content of Calculus, Macroeconomics, or Organic Chemistry expand fivefold over the past three decades?
Hardly. The intellectual core of higher education has become cheaper than ever to distribute. What exploded was the administrative apparatus, real estate arms races, and state budget disinvestment.
The Bennett Hypothesis Made Manifest
In 1987, former U.S. Secretary of Education William Bennett posited that increases in financial aid enable institutions to blithely raise tuition. Critics spent decades trying to dismiss his theory. The data has vindicated him.
Every time Washington increases the cap on federal loans or rolls out new subsidy umbrellas, university boards don’t use those funds to lower the cost barrier. They treat the capital injection as fresh room to expand tuition.
From 2000 to 2025, administrative staff positions at U.S. colleges grew at more than double the rate of faculty hires. Vice provosts of auxiliary initiatives, associate deans of lifestyle optimization, and legions of middle-tier bureaucrats collect six-figure packages. Meanwhile, tenured faculty lines are quietly retired, replaced by an underpaid, precarious adjunct underclass.
Institutions transformed from centers of learning into real estate conglomerates with tax-exempt municipal bond access, luxury student recreational complexes, and lazy investment-management arms disguised as academic endowments.
State-Level Abdication
The data reveals a stark regional pattern: the Northeast and Upper Midwest are disaster zones.
States like Pennsylvania (72%) and Illinois (50.2%) have systematically stripped direct public appropriations from their state university systems to plug holes in underfunded public pensions. When Harrisburg or Springfield faces a balance sheet crisis, the easiest cut is higher education. The universities then raise tuition to cover the deficit, effectively transforming higher education into an indirect tax collection arm for legacy public debts.
The student pays twice: once through regressive local taxes, and again through non-dischargeable student loans carrying 6% to 8.5% interest rates.
The “So What?” Factor: The Generational Wealth Cleansing
Economics is meaningless when severed from human costs. What does it actually mean when a family surrenders 50% to 70% of its pre-tax income to higher education?
It means the systematic eradication of middle-class generational wealth.
When parents pour over half their annual earnings into college, retirement security vanishes. They stop funding 401(k) accounts, let home repairs slide, and tap into home equity lines of credit (HELOCs) at peak rates.
If parents cannot or will not pay, the burden transfers directly to the student via federal Stafford loans, Parent PLUS loans, and predatory private underwriting.
The downstream damage ripples across the wider economy:
-
Delayed Family Formation: Young adults carrying the equivalent of a second mortgage cannot afford to marry, buy homes, or have children. America’s falling birth rates are deeply connected to the cost of higher education.
-
The Housing Market Freeze: First-time homebuyer median ages have surged past 35. The capital that historically funded starter home deposits now services administrative salaries in state university systems.
-
Distorted Labor Markets: Brilliant graduates shun teaching, social work, basic scientific research, and civil service because those paths cannot service a $90,000 debt load. Instead, talent is funneled into corporate litigation, quantitative finance, and enterprise software sales solely to make monthly loan payments.
(Truth requires no mirror, its reality is plain to see.) The proof of an economic model is in its fruit. If an educational system leaves its graduates broke, assetless, and afraid to start families, it is not an engine of prosperity. It is an extractive industry.
Seasonality, Anomalies, or Structural Decay?
Do not let university spokespeople tell you these 2025 numbers are a passing blip driven by post-pandemic inflation. That narrative is false.
This is a secular, multi-decade structural trend. Over the past 40 years, the consumer price index (CPI) for college tuition and fees surged by more than 1,200%, outpacing medical care, housing, and general inflation by vast margins.
The only anomaly in recent cycles was the brief surge of federal emergency relief funds that temporarily cushioned public university operating budgets. Now that those allocations have expired, the underlying rot is exposed.
Institutions face a demographic cliff: birth rates plunged after the 2008 financial crisis, meaning the cohort of 18-year-olds entering colleges between 2026 and 2032 is shrinking rapidly.
Instead of reducing costs, closing redundant campuses, and trimming bloated administrative payrolls to compete for fewer students, universities are doing the exact opposite. They are hiking tuition on the remaining student body to keep their top-heavy budgets intact. They are choosing to squeeze fewer families harder rather than fix their balance sheets.
Two-Sided Risk Assessment: The Bull vs. Bear Case
To build a reliable economic strategy, we must stress-test both perspectives.
The Bull Case: The Durable Earnings Premium
The traditional defense of high tuition rests on the labor market’s enduring “college wage premium.”
-
The Lifetime Spread: Proponents point out that the median bachelor’s degree holder still earns roughly $1.2 million to $1.5 million more over a career than a peer with only a high school diploma.
-
Technological Resilience: In an economy shaped by artificial intelligence and automation, degree holders theoretically show higher baseline adaptability, advanced critical thinking skills, and lower structural unemployment rates across recessionary cycles (2.2% vs 4.5%+ for non-degree holders).
-
Institutional Endowments as Social Safety Nets: Elite schools (Harvard, Princeton, MIT, Stanford) maintain vast endowments that allow them to offer generous, no-loan financial aid packages to lower-income students, shielding them from the headline sticker prices.
The Bear Case: The Credential Bubble Pops
The counter-narrative argues that historical data cannot accurately predict the future in an AI-disrupted economy.
-
The AI Skill Wipeout: Generative AI, natural language agents, and algorithmic automation are systematically automating the entry-level white-collar jobs that college graduates rely on to service their debts. Junior paralegals, junior financial analysts, copywriters, and entry-level software engineers are seeing their positions disappear. The wage premium is eroding at the entry level.
-
Underemployment Realities: Roughly 40% of recent college graduates are underemployed, working in roles that do not require a bachelor’s degree. They are carrying Tier-1 debt liabilities while earning Tier-5 wages.
-
The Default Wave: Parent PLUS loan delinquencies are climbing. Families who co-signed private loans are defaulting, putting older Americans’ retirement assets and home equity at risk.
-
The Alternative Credential Explosion: High-value technical trades, union apprenticeships, and targeted micro-certifications in industrial mechanics, high-voltage electrical work, and precision manufacturing offer faster tracks to six-figure earnings with zero debt.
The Alternative Scenario: The Credential Collapse
What happens if the current regime abruptly fails? We must evaluate an alternative scenario: a sudden structural rupture in the higher education business model.
If Fortune 500 companies eliminate four-year degree mandates in favor of verified technical competency tests, the financial foundations of mid-tier higher education will crack.
Without the regulatory moat of the degree, hundreds of non-flagship private and regional state universities will face insolvency. They cannot service the municipal bonds issued to build deluxe dormitories, athletic facilities, and dining halls over the past two decades.
In this scenario, we would see a wave of campus closures across the Northeast and Midwest, followed by fire-sale real estate liquidations. A systemic federal bailout debate would follow, forcing universities to accept strict price caps and income-share agreements (ISAs) tied directly to graduate employment outcomes.
Global Strategic Benchmarking: The India Parallels
This brings us to the comparative strategic benchmark: India (2026–2030–2047).
As India works toward its Viksit Bharat 2047 vision, it faces an educational fork in the road. India’s higher education system is dealing with its own severe contradictions. The cost of top-tier private engineering, management, and medical degrees has climbed dramatically, with private medical colleges charging between ₹60 lakh and ₹1.2 crore an astronomical 300% to 600% of an Indian upper-middle-class family’s annual income.
Yet India still preserves an invaluable public asset: its elite government institutions (IITs, NITs, IIMs, AIIMS, and central universities). Despite periodic fee revisions, these institutions remain heavily subsidized, merit-gated, and accessible through transparent, ultra-competitive examinations. A year of tuition at an IIT costs approximately ₹2.5 to ₹3 lakh, balanced by state fee waivers for economically weaker sections.
The Warning for India’s Policy Architects
If India allows its higher education system to mimic the American private-credit model, it risks derailing its economic ambitions.
India cannot afford to saddle its young demographic dividend with unproductive, speculative educational debt. A country cannot transform into a global manufacturing, deep-tech, and space superpower if its youth are trapped paying off inflated tuition bills for low-quality degrees.
The American crisis offers a clear warning: market mechanisms cannot discipline an industry where the product is a social status gatekeeper, the financing is backed by public debt guarantees, and the sellers bear zero downside risk when their graduates end up unemployed.
Structural Reforms: The Policy Playbook
If a government wanted to resolve this crisis rather than simply profit from it, the policy playbook is clear and unapologetic.
-
Skin in the Game (Risk-Sharing): Make colleges directly liable for a portion of their students’ student-loan defaults. If an institution’s graduates cannot service their debts within five years of leaving, garnish the university’s operating budget and tax-advantaged endowment payouts. Tuition would drop overnight.
-
Restoring Bankruptcy Protections: Rescind the 2005 bankruptcy reform provisions that made private and federal student loans virtually non-dischargeable. Allow graduates to discharge educational debt under standard Chapter 7 proceedings after seven years. Lenders would immediately stop underwriting bad degrees at predatory institutions.
-
Direct Administrative Headcount Caps: Condition federal research funding, Title IV student loan eligibility, and tax exemptions on maintaining a strict 1:1 ratio between instructional faculty and administrative personnel. Eliminate bloated administrative overhead.
-
Endowment Taxation: Levy an escalating federal excise tax on private university endowments exceeding $1 million per enrolled student unless those institutions commit to covering 100% of tuition for students from families earning under their state’s median income.
-
Federal Loan Caps: Impose hard caps on the total amount an individual can borrow through federal channels, including Parent PLUS programs. Universities will be forced to cut tuition to match the ceiling of available student capital.
Strategic Blueprint: The 2026–2030–2047 Horizon
Looking forward across the next two decades, the balance of power will shift away from degree-granting cartels toward demonstrable skills and lean credentialing models.
The 2026–2030 Phase: The Breaking Point
Expect a sharp increase in small, private college bankruptcies and public regional campus consolidations across Pennsylvania, New York, Ohio, and Wisconsin. The demographic drop-off will starve tuition-dependent schools of enrollment.
Families will increasingly steer their children toward community college transfer programs, high-end technical trades, and institutions that offer direct corporate hiring pipelines.
The 2030–2037 Phase: The Great Restructuring
Legislatures will be forced to tie university funding to graduate earnings and employment metrics.
The historical model of the four-year residential degree will increasingly become a luxury product reserved for the global wealthy. The broader middle class will rely on hybrid, skill-verified apprenticeships and specialized digital institutions.
The 2037–2047 Phase: The Post-Credential Economy
By the centenary of Indian independence in 2047, the traditional four-year degree will no longer hold its historical monopoly over social mobility.
Continuous skill portfolios, real-time workplace assessments, and corporate apprenticeships will replace the legacy credential. Nations that shielded their citizens from unproductive educational debt will dominate this era, while those that permitted debt-funded degree inflation will struggle with stagnant growth, declining birth rates, and hollowed-out middle classes.
My Verdict
The numbers in this report are not just lines on a spreadsheet; they represent real families taking on dangerous financial burdens for a credential that no longer guarantees a stable future.
When a university in Pennsylvania, Rhode Island, or New York demands 67% to 72% of a family’s annual earnings, you are not participating in the American Dream. You are funding an extractive institutional machine that leaves families vulnerable and burdens graduates with debt.
(Regret is useless once the harvest has been lost to the birds.) Do not wait for policy makers to fix this broken system for you. Protect your balance sheet now.
Tactical Action Plan for Families and Investors:
-
Reject the Brand Traps: Stop mortgaging your financial future for second-tier private universities that offer Ivy League sticker prices without the corresponding alumni network.
-
Embrace Strategic Geographies: If you are in the United States, look closely at states with lower cost ratios such as Florida (37.2%), Texas (37.6%), or North Carolina (45.3%) or leverage two-year community colleges before transferring to a flagship state university.
-
Look to Global Alternatives: Consider English-language degree programs at top-tier European institutions in Germany, the Netherlands, or Ireland, where total annual tuition is a fraction of American private costs.
-
Prioritize Liquid Net Worth: Do not raid your retirement accounts or draw down home equity to finance an undergraduate degree. Your child can borrow for college if necessary; you cannot borrow for retirement.
Higher education is a commercial service. Start treating it like one. Refuse to pay an inflated price for a product that fails to deliver a measurable return, and keep your family’s financial foundation secure.
GOOGLE ‘PEOPLE ALSO ASK’ FAQs
Q1: What percentage of family income does college cost across US states in 2025?
A: 45.2% of median pre-tax household income is required nationally to fund college, climbing to a catastrophic 72% in Pennsylvania and 70.8% in Rhode Island. Even lowest-cost states like Hawaii still extract 34.8% of gross household earnings.
Q2: Which US state has the most unaffordable college tuition relative to income?
A: 72% of annual median income is consumed by college costs in Pennsylvania, ranking it as the most unaffordable state in the nation. It is immediately followed by Rhode Island at 70.8%, New York at 67.9%, and Massachusetts at 63.5%.
Q3: Why has the cost of college outpaced median household income growth?
A: 1,200% tuition inflation over four decades stemmed directly from uncontrolled administrative expansion, state-level budget defunding, and limitless federal loan availability. Universities leveraged non-dischargeable student borrowing to expand non-academic payrolls rather than lowering instructional delivery costs.
Q4: How does US higher education cost compare to international benchmarks?
A: 1.8% to 3% of median income covers university costs in Germany due to state-funded tuition waivers, compared to 45.2% in the United States. Australia caps repayments using income-contingent loans, while premier Brazilian public universities remain completely tuition-free.
Q5: What will happen to college costs and degree value by 2030?
A: 20% to 30% enrollment contractions driven by post-2008 demographic deficits and AI automation of entry-level corporate jobs will trigger regional campus closures before 2030. Unfunded institutions face insolvencies as employers discard degree prerequisites for verified skills.
Data Source:
- U.S. Department of Education (NCES/IPEDS)
- U.S. Census Bureau (ACS Median Household Income Datasets)
- College Board (Trends in College Pricing)
- OECD Education at a Glance.
Disclaimer: This report is for informational and analytical purposes only and does not constitute formal financial, investment, or policy advice.