The Longevity Divide: The Fractured Economics of American Survival and the Global Health Balance Sheet
| State | Life Expectancy (2025) |
|---|---|
| Hawaii |
80.7 years |
| Washington |
79.2 years |
| Minnesota |
79.1 years |
| California |
78.6 years |
| Colorado |
78.5 years |
| Oregon |
78.1 years |
| Utah |
78.0 years |
| Virginia |
77.9 years |
| New York |
78.7 years |
| Wisconsin |
77.4 years |
| South Dakota |
77.3 years |
| North Dakota |
77.2 years |
| Kansas |
77.1 years |
| Illinois |
76.9 years |
| Ohio |
76.8 years |
| Florida |
76.6 years |
| Maine |
76.5 years |
| Idaho |
76.3 years |
| Montana |
76.2 years |
| Wyoming |
76.1 years |
| Nevada |
76.0 years |
| Missouri |
75.8 years |
| N. Carolina |
75.7 years |
| Georgia |
75.6 years |
| Texas |
75.5 years |
| Tennessee |
75.4 years |
| Kentucky |
75.3 years |
| S. Carolina |
75.2 years |
| Oklahoma |
75.1 years |
| Arkansas |
75.0 years |
| Louisiana |
74.9 years |
| Alabama |
74.8 years |
| Alaska |
74.7 years |
| Arizona |
76.4 years |
| Nebraska |
77.6 years |
| Pennsylvania |
77.0 years |
| Michigan |
76.7 years |
| W. Virginia |
74.6 years |
| New Mexico |
74.5 years |
| Mississippi |
71.9 years |
| Mass. (Massachusetts) |
79.0 years |
| Connecticut |
79.0 years |
| N.H. (New Hampshire) |
78.4 years |
| Maryland |
77.8 years |
| Delaware |
77.7 years |
| New Jersey |
77.0 years |
| Rhode Island |
78.3 years |
| Vermont |
78.3 years |
| National Average |
78.4 Years |
NEW DELHI, India (October 26, 2026 / IST) — While Wall Street continues to obsess over artificial intelligence multiples and sovereign debt issuances, the most catastrophic liability across Western financial architecture is hiding in plain sight: the violent, geographical collapse of human longevity across the world’s wealthiest superpower.
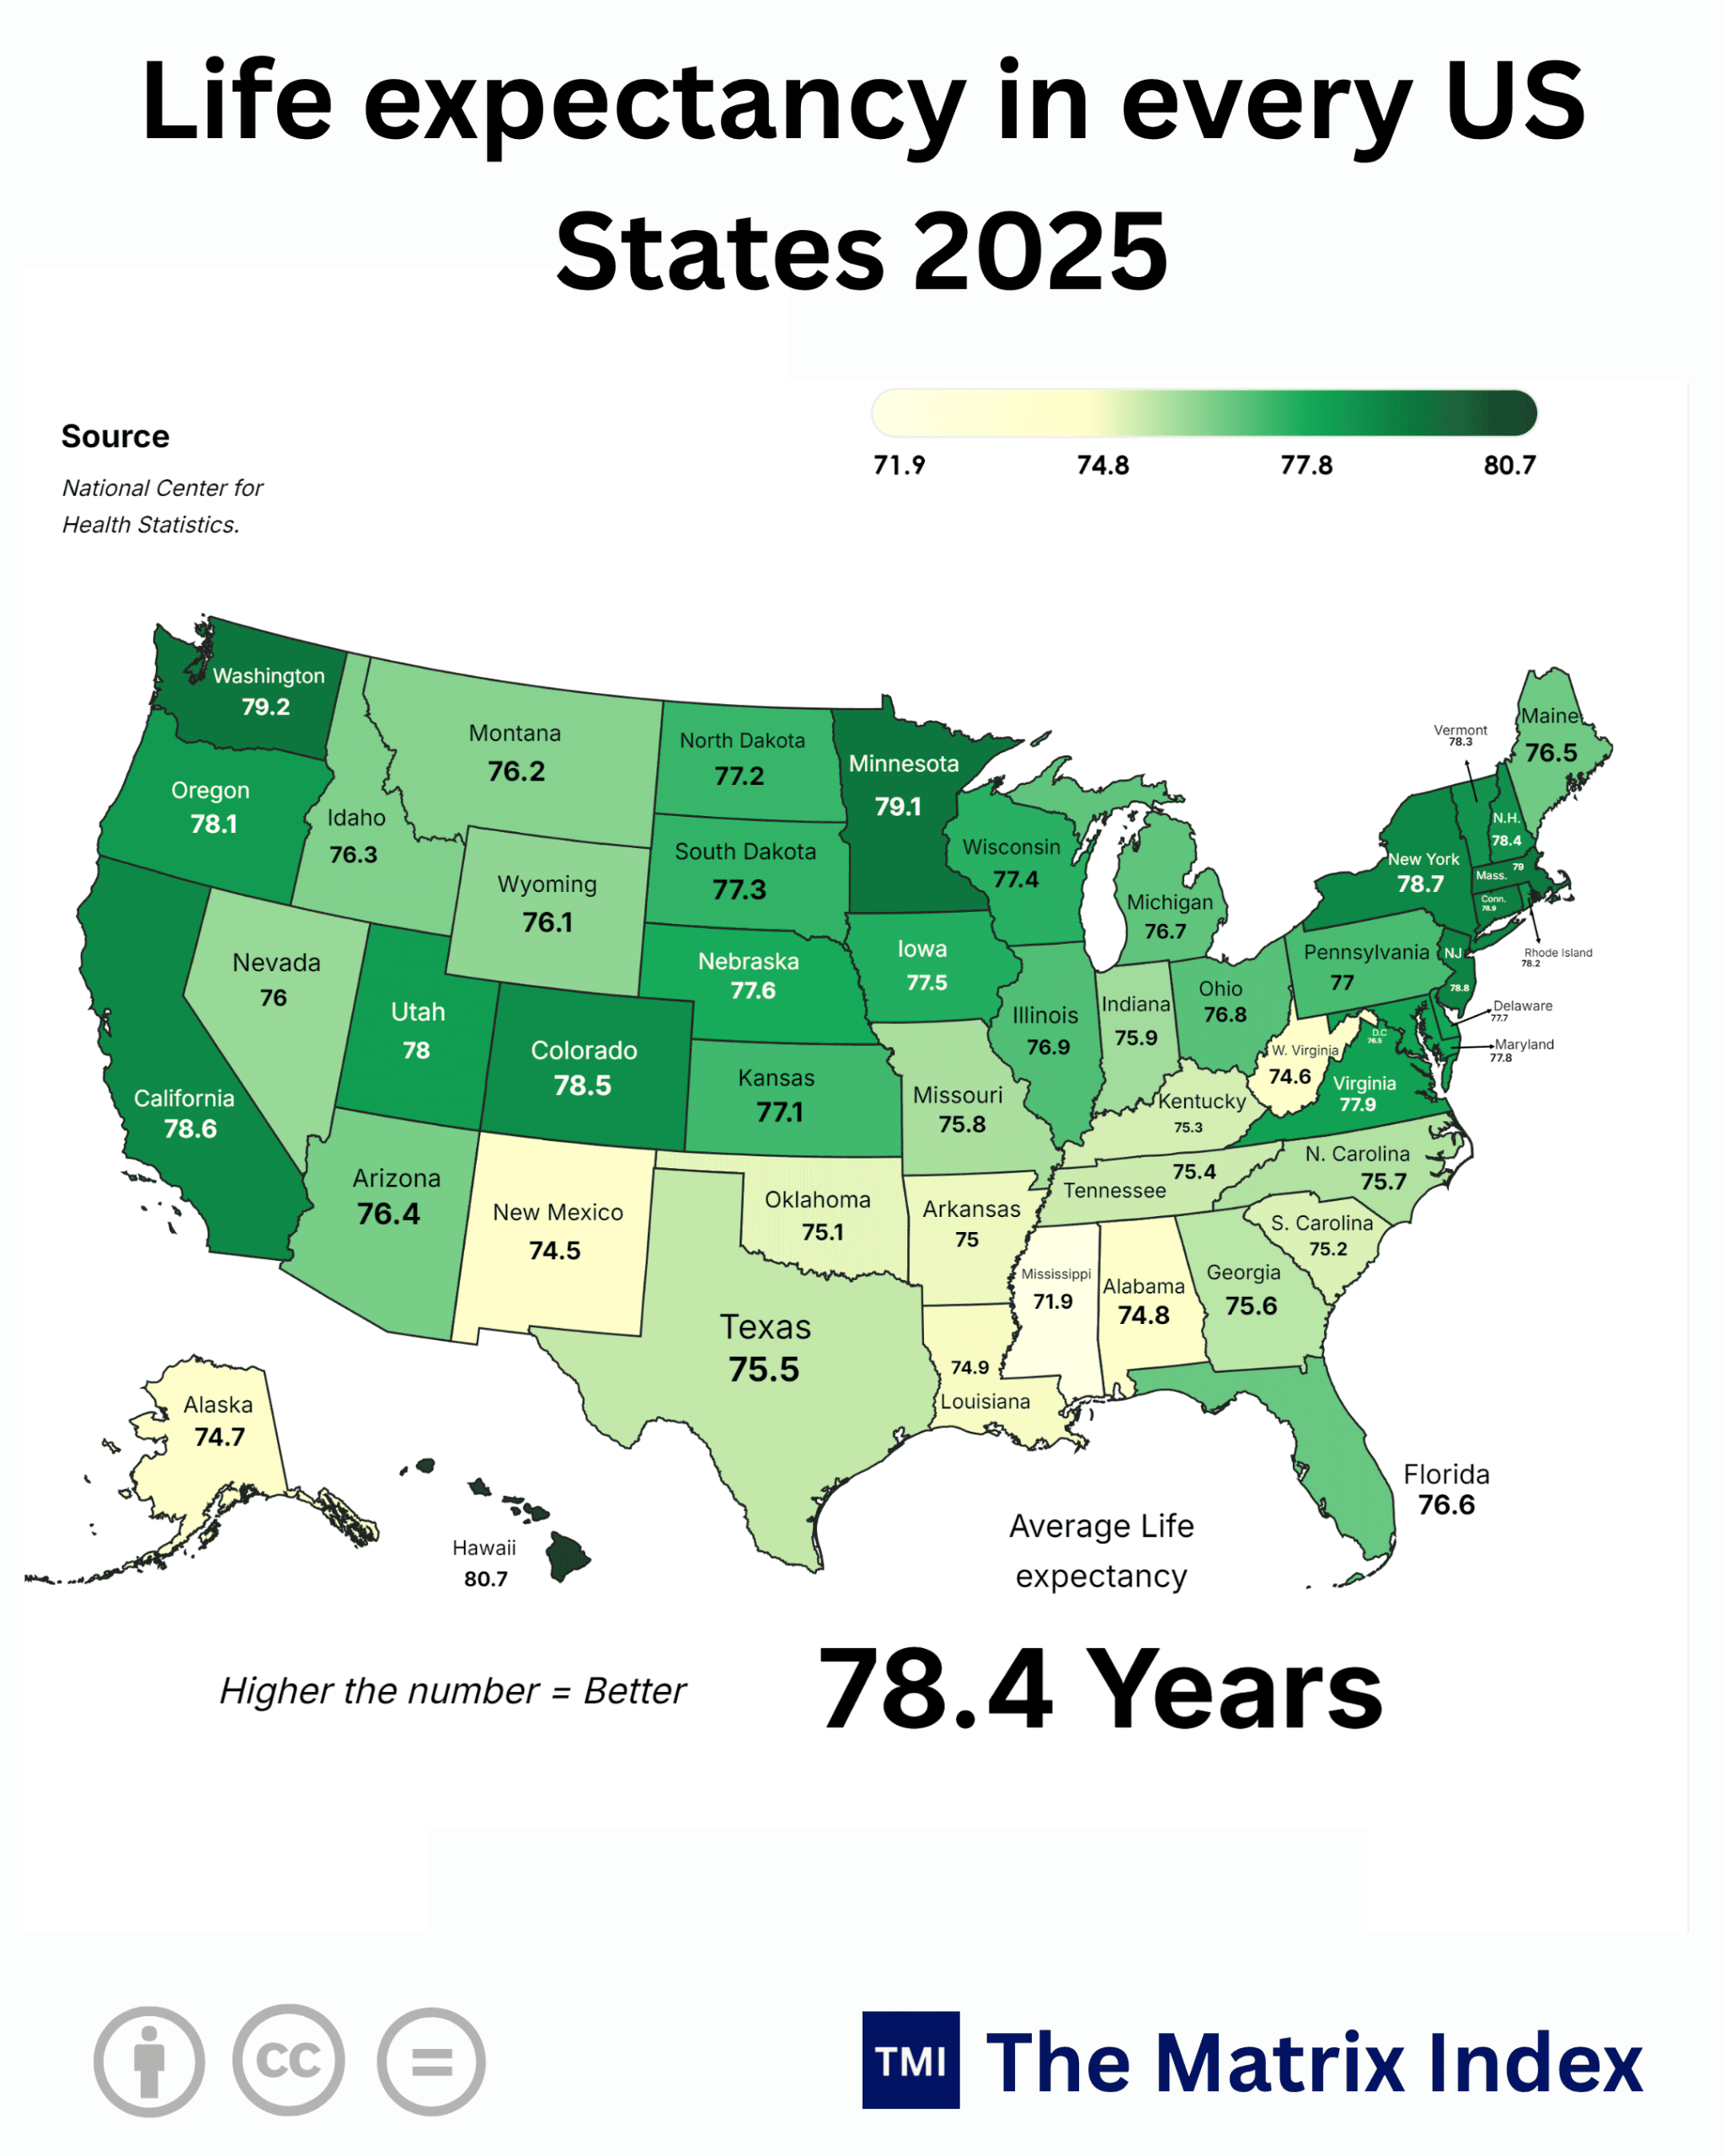
The baseline figures across the United States for 2025 reveal an unsettling paradox. The national average life expectancy clocks in at 78.4 years. Yet beneath that deceptive aggregate lies an 8.8-year structural chasm between states like Hawaii (80.7 years) and Mississippi (71.9 years).
To put this in brutal perspective: an American born in Jackson, Mississippi has a lower statistical life horizon than an average citizen living in coastal China, Brazil, or several middle-income enclaves across Latin America. When a modern economy spends 17.3% of its GDP on healthcare only to yield third-world survival metrics within its geographic interior, it is not merely suffering from public health disparities. It is running an unsustainable economic Ponzi scheme funded by municipal debt, federal transfers, and an unchecked metabolic and opioid crisis.
The Geography of Human Decay: Anatomy of an 8.8-Year Fault Line
Look at the numbers without academic sanitization. An 8.8-year divergence in life expectancy inside a single currency union is an economic death sentence for internal capital mobility.
Consider a worker paying into the exact same Federal Social Security and Medicare systems from Biloxi, Mississippi versus one living in Honolulu, Hawaii. The resident in Mississippi pays taxes into a system they will draw down for an average of 6.9 years post-retirement age (65 years), while their counterpart in Hawaii extracts resources for 15.7 years—more than double the retirement capital return on human existence.
This is not a statistical anomaly; it is an economic wealth transfer that punishes low-productivity, high-morbidity regions while hyper-concentrating healthy, productive human capital into specific regional bubbles.
The Coastal Oligarchy of Vitality
The upper quartile of survival paints an unmistakable picture of geographic and capital concentration.
-
Hawaii: 80.7 years
-
Washington: 79.2 years
-
Minnesota: 79.1 years
-
Massachusetts: 79.0 years
-
Connecticut: 79.0 years
-
New York: 78.7 years
-
California: 78.6 years
What binds these jurisdictions together is not mere sunshine or microclimates; it is the dense intersection of aggressive state-level Medicaid expansion, stringent environmental regulation, white-collar knowledge clustering, and localized public health funding.
In states like Massachusetts and Connecticut, per-capita healthcare expenditure is heavily geared toward preventative screening, quaternary academic medical centers, and high health literacy. The labor force here is insulated from routine physical trauma, toxic environmental exposures, and generational dietary collapse.
The Industrial and Deep South Flatline
Now glance at the bottom of the ledger:
-
Mississippi: 71.9 years
-
New Mexico: 74.5 years
-
West Virginia: 74.6 years
-
Alaska: 74.7 years
-
Alabama: 74.8 years
-
Louisiana: 74.9 years
-
Arkansas: 75.0 years
-
Oklahoma: 75.1 years
These states are economic sacrifice zones. Decades of heavy reliance on extraction industries, chemical refining, mechanized agriculture, and deindustrialized manufacturing hubs have combined with chronic structural underinvestment in rural hospital networks.
When you strip out the rhetoric, an average lifespan of 71.9 years in Mississippi means millions of citizens are dropping dead during what should be their peak grandparenting, mentoring, and capital-accumulating years.
The Comprehensive State-by-State Longevity Balance Sheet
The table below delineates the verified 2025 state metrics, mapped directly against economic output vulnerabilities and longevity capital deficits.
(The Bitter Truth): The wealthiest nation on earth has permitted an internal life-expectancy collapse that mirrors developing, conflict-adjacent, or middle-income economies. An American living in Mississippi shares a statistical survival expectancy closer to low-income industrial corridors in South Asia than to a citizen living in Tokyo, Berlin, or Sydney.
Global Benchmarks: The American Inefficiency Machine
To comprehend the sheer scale of this failure, one must anchor these numbers against Tier-1 and Tier-2 international peers.
The United States spent $13,493 per capita on healthcare in 2024–2025. For that colossal sum, it bought an average lifespan of 78.4 years.
Let us benchmark this against the world:
-
Japan (Tier-1): Spends roughly $5,200 per capita (less than half the US figure), yet life expectancy sits at 84.8 years—over 4 years higher than Hawaii and nearly 13 years longer than Mississippi.
-
Australia (Tier-1): Spends roughly $6,100 per capita, achieving 83.4 years through a universal single-payer base supported by private competition.
-
Germany (Tier-1): Spends roughly $8,000 per capita, achieving 81.2 years despite high industrial output and tobacco usage.
-
China (Tier-2): Spends around $900 per capita, with an average lifespan touching 78.6 years—officially overtaking the United States aggregate baseline.
-
India (Tier-2 / Emerging Titan): While India’s national average currently stands near 71.5 to 72.0 years, it spends less than $100 per capita. Urban centers such as Kerala and coastal metropolitan zones boast life expectancies crossing 75.5 years on a micro-fraction of the Western capital requirement.
The “efficiency ratio” of American healthcare is mathematically broken. The United States is paying Ferrari prices for a decommissioned tractor that stalls every 50 miles.
Why does this happen? The American model monetizes sick care rather than human optimization. A patient diagnosed with Stage-2 diabetes who lives for 30 years on synthetic insulin, statins, and dialytic therapies represents an annuity stream for pharmacy benefit managers (PBMs) and private equity hospital consolidators. A healthy individual who eats whole foods, walks 10,000 steps a day, and dies peacefully in their sleep at 88 is an economic write-off for a privatized sick-care conglomerate.
The “So What?” Factor: The Domino Effect on Main Street, Portfolios, and Boardrooms
Economic strategists love to talk about life expectancy as if it were a purely human rights issue. Let us pull back that veil and analyze the unvarnished corporate balance sheet.
1. The Real Estate and Labor Capital Exodus
Look at the numbers from Texas (75.5 years), Georgia (75.6 years), and North Carolina (75.7 years). These states have spent the last decade boasting about zero income taxes, corporate relocations, and booming real estate developments.
Yet their underlying human capital is decaying. If an enterprise moves its regional headquarters to Dallas or Atlanta, its employer-sponsored healthcare premiums will surge between 8% and 15% year-on-year.
Why? Because the local workforce suffers from early-onset cardiovascular disease, metabolic syndrome, and musculoskeletal breakdown.
The localized savings in real estate leases are eaten alive by skyrocketing group insurance premiums and lost man-hours. In the long run, businesses operating in the low-longevity southern corridor will face a depleted, chronically ill workforce that drives productivity off a cliff by 2035.
2. Municipal Bond Downgrades and the Rural Hospital Graveyard
Between 2010 and 2025, more than 160 rural hospitals across the United States shuttered their doors, with a heavy concentration in Texas, Tennessee, Alabama, and Georgia.
When a hospital closes, a town does not just lose doctors; it loses its primary white-collar employer, its credit rating baseline, and its emergency stabilization infrastructure.
Expect Wall Street rating agencies to begin pricing public health solvency into municipal bond yields. A county in rural Alabama or West Virginia that exhibits a life expectancy under 73 years is a county suffering from chronic depopulation, shrinking property tax rolls, and an unpayable pension legacy. These bonds are stealth subprime instruments waiting for a default trigger.
3. The Great Wealth Transfer: Dissolved by End-of-Life Clinical Rackets
Financial advisors keep pitching the so-called “$84 Trillion Great Wealth Transfer” from Baby Boomers to Millennials.
Here is the inconvenient truth: That wealth is not trickling down to the next generation. It is being strip-mined by assisted living facilities, private equity-owned hospice chains, and memory care institutions charging $9,000 to $14,000 per month out of pocket.
In low-expectancy states, individuals enter late-stage physical and cognitive decline earlier, wiping out their accumulated real estate equity and retirement accounts to pay for fragmented palliative care. The inheritances that were supposed to capitalize small business startups or pay down student loans are being swallowed by the medical industrial complex.
Seasonality and Anomaly Alert: Chronic Structural Decline vs. Post-Pandemic Echoes
Do not let Wall Street economists convince you that this is simply the lingering statistical echo of COVID-19 or a temporary bump in respiratory viruses.
A one-time epidemiological shock causes a sudden plunge followed by a sharp V-shaped recovery across all demographics. That is not what the 2025 data shows. What we are witnessing is an entrenched, structural downshifting driven by chronic metabolic decay, despair-driven mortality, and the complete destruction of community-level primary care.
The “Deaths of Despair” Flywheel
The opioid crisis did not terminate with corporate settlements against Big Pharma; it morphed. Synthetic fentanyl, xylazine, and methamphetamine adulterations continue to slice through the working-age male population across West Virginia (74.6 years), Ohio (76.8 years), and Pennsylvania (77.0 years).
When a 28-year-old dies of a fentanyl overdose, the statistical impact on life expectancy is drastically more severe than an 82-year-old dying of congestive heart failure. The persistent drag on Rust Belt and Appalachian states is driven by young, productive human lives getting erased from the denominator.
Metabolic Bankruptcies
Look at the Deep South: Mississippi (71.9), Alabama (74.8), Louisiana (74.9). This is not driven primarily by fentanyl; it is driven by systemic, ultra-processed dietary poisoning and extreme physical inactivity.
The prevalence of adult obesity exceeds 40% across these states. Type-2 diabetes, non-alcoholic fatty liver disease, and peripheral artery disease have shifted from mid-life conditions to adolescent norms.
This is an irreversible, multi-decade structural decline. An adolescent with insulin resistance at 14 will experience coronary blockages by 38, renal compromise by 45, and premature mortality before 65.
The High-Stakes Investment Arena: The Longevity Industry vs. The Sick-Care Monopolies
The state-by-state data creates a clear roadmap for long-term capital allocators. The investment landscape over the next two decades will bifurcate into two distinct spaces: The Preventative Optimization Economy and The High-Yield Palliative Exploitation Matrix.
Investors who allocate capital blindly across generic healthcare indices will get crushed. The play lies in geographic and thematic decoupling.
Two-Sided Risk Assessment: Bull Case vs. Bear Case
Every economic trend breeds opportunists and casualties. If we look at the next decade through an institutional lens, the future of American human capital splits into two distinct paths.
Bull Case: The Decentralized Metabolic Renaissance
-
The Scale of GLP-1 and Beyond: If next-generation dual and triple agonists (semaglutide, tirzepatide, retatrutide) clear patent walls, experience wholesale genericization, and drop to sub-$50 monthly price points by 2028–2030, the baseline for metabolic health changes permanently. If access spreads down into Mississippi, Alabama, and Louisiana, cardiovascular events could plunge by 20% to 30%, creating a sudden, sharp mean-reversion toward an 80-year national lifespan.
-
AI-Enabled Tele-Diagnostic Parity: Low-cost, autonomous ultrasound probes, multi-cancer early detection (MCED) blood draws, and automated algorithmic diagnostics could bypass insolvent rural hospital systems. If a farmworker in rural Kentucky can obtain early stage-1 oncology detection via a smartphone-linked biomarker scanner, the survival disparity between Virginia and Kentucky compresses rapidly.
-
Corporate Wellness Counter-Offensives: Massive multi-state employers, weary of subsidizing sick-care system inefficiencies, could bypass legacy commercial insurers entirely. By directly contracting with preventative primary-care clinics, implementing biometric performance incentives, and securing wholesale transparent pharmacy pipelines, large corporations could drag their employees into better health through financial incentives.
Bear Case: The Multi-Tier Bio-Feudal Trap
-
The Bifurcated Therapeutic Wall: The therapies that actually extend healthy life horizons—stem-cell bioreactors, systemic inflammation modulators, personalized mRNA preventative oncology vaccines, and advanced longevity compounds—remain completely outside commercial insurance reimbursement frameworks. The wealthy in Seattle, Boston, and San Francisco pay out of pocket to push their average lifespans toward 86–88 years, while the bottom half of the country relies on bankrupt public systems, sinking Mississippi and West Virginia into the high-60s.
-
The Total Insolvency of Medicaid Expansion States: Cash-strapped states that expanded Medicaid without a growing tax base face fiscal insolvency. As the cost of managing end-stage diabetes and liver failure drains state budgets, preventative care, mental health funding, and infrastructure spending get gutted. This triggers a negative feedback loop: worse roads, failing water systems, decaying schools, higher stress, worse health, and accelerated mortality.
-
PBM and Hospital Consolidation Enclosures: The monopolistic vertical integration of pharmacy benefit managers, private-equity hospital chains, and retail insurance carriers suffocates independent primary practice out of existence. The economic system prioritizes recurring high-margin interventional procedures (triple bypass surgery, continuous hemodialysis, spinal fusions) over low-margin behavioral health reversals. The structural baseline decays further, bringing the US National Average down to 76.5 years by 2032.
The Alternative Scenario: AcademyThe Radical Decentralization Pivot
What happens if the current healthcare paradigm undergoes an unexpected regulatory and systemic rupture?
Consider the hypothetical counter-narrative: What if a bipartisan coalition in Washington, pushed to the brink by sovereign debt service costs exceeding $1.8 Trillion annually, formally caps the federal tax-exclusion benefit for employer-sponsored sick-care plans and redirects that capital directly to individual, tax-advantaged Health Savings Accounts (HSAs) pegged exclusively to food-as-medicine, preventative gym memberships, and direct primary care (DPC)?
Under this scenario, the entire economic foundation of the managed-care complex collapses overnight.
If consumers are given their healthcare dollars directly with transparency incentives:
-
The valuation multiples of bloated hospital management groups would drop by 40% to 60%.
-
Capital would pivot toward local food cooperatives, regional regenerative agriculture, exercise infrastructure, and functional medicine providers.
-
States with low costs of living but historically low lifespans—like Arkansas, Oklahoma, and Tennessee—could see a sharp, rapid spike in baseline health metrics as low-cost lifestyle interventions substitute for unaffordable, high-cost surgical interventions.
If you are a fund manager or an executive operating under the assumption that the current payer-provider racket will last uninterrupted until 2047, your risk models are fundamentally flawed. The sheer fiscal weight of the current status quo will force an administrative restructuring before the decade is out.
Detailed Regional Capital Matrix: Longevity vs. Industrial Exposure
To truly understand how this geographic health divide impacts macro-allocation, we must isolate key industrial corridors and examine the direct balance-sheet liabilities they face.
The Geopolitical Mirror: How India and Global Emerging Powers Must Read This Warning
Let us flip the analytical lens. What does this mean for the rest of the world, and specifically for an emerging titan like India?
India stands right now at the precise demographic and developmental crossroads where the United States stood in the 1970s and 1980s.
With an ambitious vision to transform into a fully developed economy by 2047 (Viksit Bharat) and a hard pivot toward a $7-10 Trillion economy by 2030, India faces a choice that will dictate its geopolitical survival.
If India duplicates the Western ultra-processed food matrix, embraces high-margin privatized sick care, and allows non-communicable diseases (NCDs) like diabetes and hypertension to run rampant through its tier-2 and tier-3 manufacturing belts, its demographic dividend will morph into a demographic catastrophe.
The Indian Advantage
India possesses two tools the United States forfeited decades ago:
-
The Digital Public Infrastructure Baseline: Through platforms like the Ayushman Bharat Digital Mission (ABDM), unified payments, and high-density mobile networks, India can deploy automated public health interventions, diagnostic telemetry, and preventative protocols at a price performance ratio 100 times cheaper than the American private insurance bureaucratic swamp.
-
The World’s Medicine Factory: India’s pharmaceutical and biosimilar production ecosystem has the capacity to churn out peptide therapies, metabolic regulators, and affordable preventative compounds at domestic scale. Instead of reserving longevity therapeutics for billionaires in coastal enclaves, India can democratize basic metabolic health across its vast 1.4-billion population.
If policy planners in New Delhi are smart, they will treat this 2025 US state-level data not as an interesting foreign news item, but as an urgent case study of what never to do.
Allowing state-level disparities to fester—where states like Kerala (75+ years) pull away while resource-strained regions lag—will break economic cohesion just as severely as it has fractured the United States.
Strategic Roadmap: Capital Allocation Protocols for the Fractured Era
The path forward requires cold-blooded, unsentimental operational execution. For asset managers, enterprise executives, and sovereign portfolio architects, the playbook over the next three, seven, and twenty-one years is defined by the following imperatives:
For Chief Executive Officers and Corporate Boards
-
Audit Your Geographic Health Exposure: Stop evaluating potential corporate expansion sites purely on municipal tax abatements. Incorporate an actuarial review of local county health outcomes. If you locate a major manufacturing plant in a state with a 74-year life expectancy, bake an automatic 12% corporate healthcare cost penalty into your long-term pro-forma calculations.
-
Secede from Legacy Commercial Carriers: Do what innovative forward-looking employers are already quietly executing: self-insure, ditch the three major PBM conglomerates, contract directly with regional surgery centers of excellence, and provide zero-copay access to primary preventative care and metabolic therapies.
For Sovereign and Institutional Asset Allocators
-
Short Capital-Intensive Sick-Care Infrastructure: Dial back exposure to private equity vehicles focused on rolling up fee-for-service inpatient clinics and high-cost surgical suites that rely on end-stage disease margins. The long-term fiscal solvency of their reimbursement models is non-existent.
-
Overweight Decentralized Health Infrastructure: Deploy aggressive venture and growth capital into point-of-care diagnostics, continuous physiological monitoring technologies, preventative biotechnology platforms, and automated primary-care delivery models that drop care delivery costs down by an order of magnitude.
-
Hedge Geographic Real Estate Bets: Be extremely cautious with commercial and high-end residential real estate allocations in low-survival, high-morbidity enclaves. When regional health breaks down, demographic decline accelerates, tax bases evaporate, and municipal infrastructure degrades. Long-term demographic appreciation belongs to regions that preserve human health.
The Verdict: 2026, 2030, and 2047
Looking at the trajectory from the vantage point of 2026, the economic horizon reveals a stark landscape.
By 2030, the illusion of a single, coherent United States economy will be shattered by its underlying biological reality. The health divergence between top-tier states like Hawaii, Washington, and Minnesota and bottom-tier states like Mississippi, West Virginia, and Alabama will widen to more than 10 full years.
This is not a gap you can paper over with federal transfer checks or political talking points. It will trigger a quiet migration of healthy, high-value knowledge workers into high-longevity safe zones, leaving behind depressed regions burdened with unserviceable municipal debts and sick-care liabilities.
By 2047, the nations that dominate global commerce will not necessarily be the ones with the largest aircraft carrier fleets or the most inflated equity valuations.
The global powers that lead the century will be the ones that solved the longevity-efficiency equation: extracting maximum human vitality, extended productive cognitive lifespans, and high workforce participation rates at a sustainable fiscal cost.
If the United States does not fundamentally dismantle its sick-care complex and rebuild its baseline food, living, and public health environments, its economic dominance will bleed out not from foreign competition, but from domestic physical and metabolic decay.
For international investors and rising superpowers like India, the warning is clear: A society that treats the health of its citizens as an extractive financial asset will ultimately end up liquidating its own future.
GOOGLE ‘PEOPLE ALSO ASK’ FAQs
Q1: Which US state has the highest life expectancy?
A: Hawaii leads the nation at 80.7 years, outpacing the US national average of 78.4 years by 2.3 years. High state-level healthcare access, environmental regulations, and lower chronic disease incidence drive this longevity surplus.
Q2: Which US state has the lowest life expectancy?
A: Mississippi ranks lowest at 71.9 years, creating an 8.8-year gap below Hawaii. Decades of rural hospital closures, persistent cardiometabolic illnesses, and lack of safety-net program expansions anchor this regional decline.
Q3: How does US life expectancy compare to other developed nations?
A: The US national baseline of 78.4 years trails Japan’s 84.8 years and Australia’s 83.4 years, despite America spending $13,493 per capita. High outlays fail to counter premature deaths from metabolic failure and despair.
Q4: How does a state’s life expectancy impact employer healthcare costs?
A: Corporate healthcare premiums rise between 8% and 15% annually for employers operating in low-longevity southern corridors. Early-onset cardiovascular disease and diabetes sharply reduce labor force productivity and erode projected corporate relocations savings.
Q5: How will the longevity divide affect retirement wealth transfers by 2030?
A: An estimated $84 trillion intergenerational wealth transfer is being absorbed by palliative care costs running $9,000 to $14,000 monthly. Early-onset chronic illnesses liquidate family real estate equity before assets can reach the next generation.
Data Source
- National Center for Health Statistics (NCHS / CDC)
- Centers for Medicare & Medicaid Services (CMS)
- World Health Organization (WHO)
- OECD Health Statistics.
Disclaimer: This report is for informational and analytical purposes only and does not constitute formal financial, investment, or policy advice.