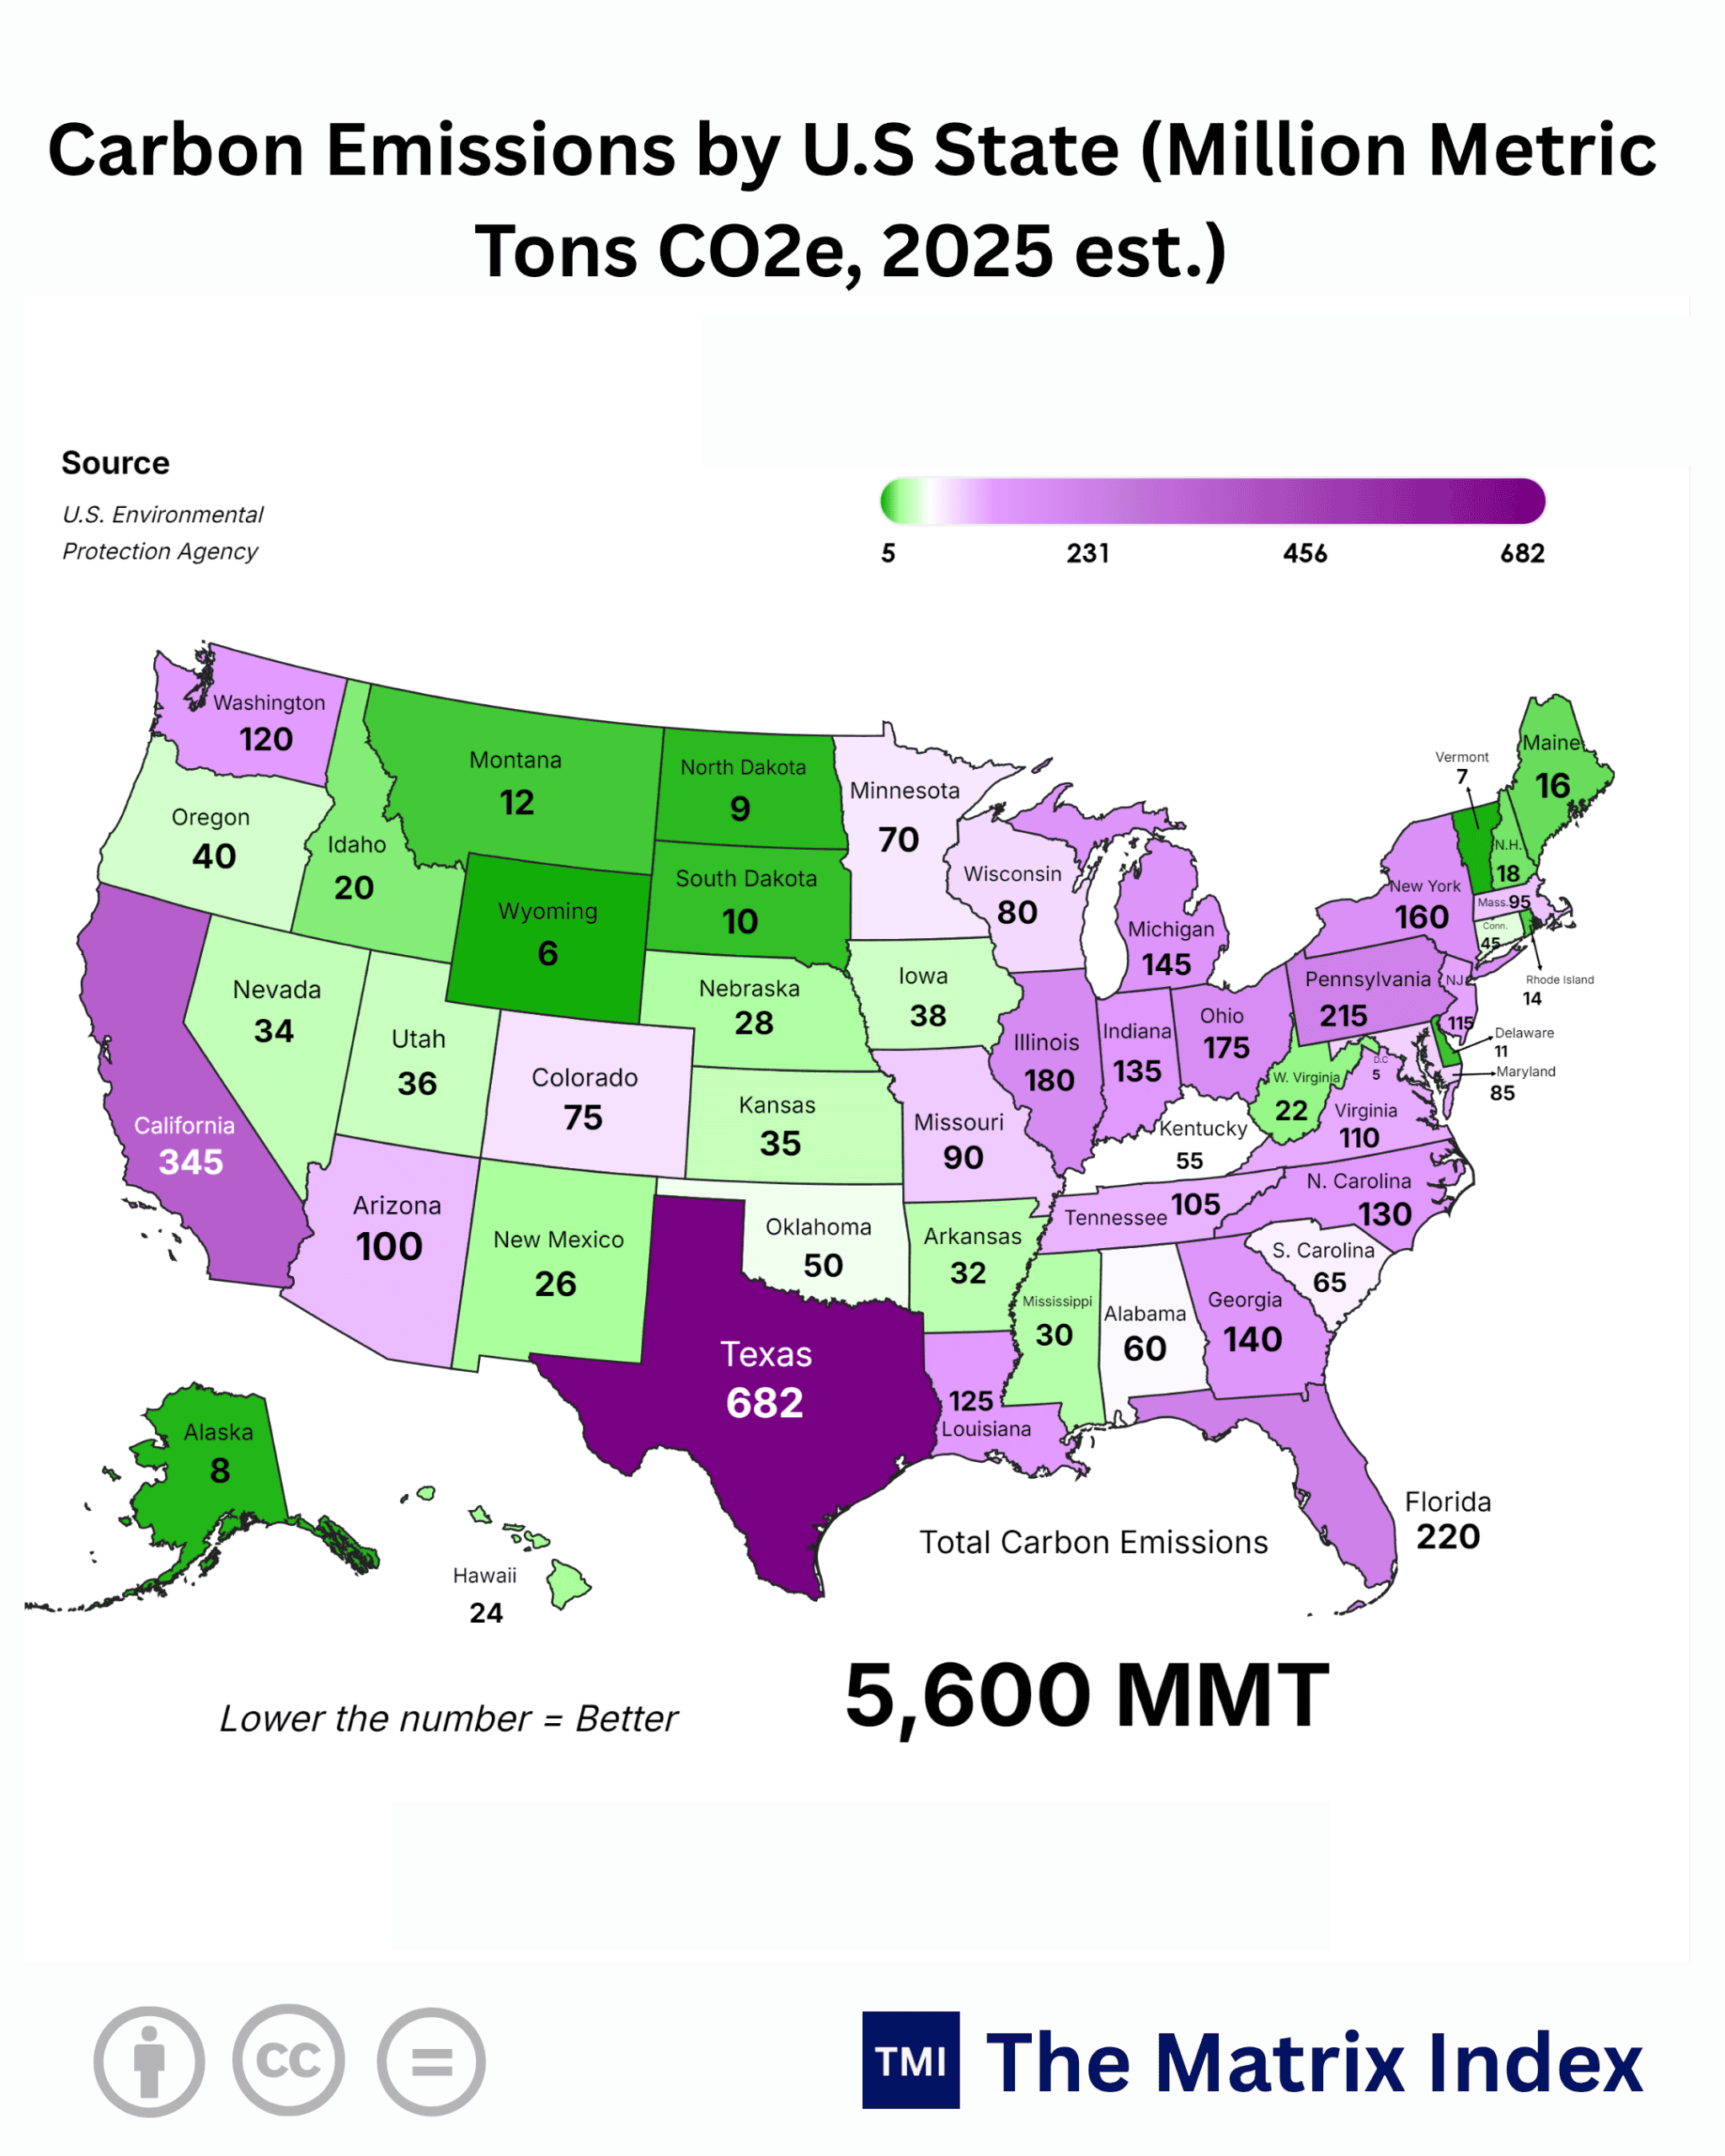
NEW DELHI, India (November 02, 2026 / IST) — If you still believe global decarbonization is an orderly, shared march toward ecological purity, you are being sold an expensive fairy tale by boardroom consultants and political opportunists. Look squarely at the raw numbers: the United States emitted roughly 5,600 Million Metric Tons (MMT) of CO2 equivalent in 2025, but that national aggregate hides a brutal, structural civil war between heavy industrial states and coastal service sanctuaries.
The top ten emitting American states alone account for more than 2,400 MMT nearly half the output of the entire country. To put that into perspective, Texas alone, at 682 MMT, coughs up more industrial carbon than the entire United Kingdom, France, and Spain combined. When one single state produces more carbon emissions than Germany’s total annual energy and manufacturing balance, claiming that localized carbon taxes or green subsidies will solve global warming without triggering an industrial collapse is pure intellectual dishonesty.
The Great Carbon Chasm: How Structural Economics Defeated Green Dogma
Let us strip away the corporate ESG rhetoric and examine the engine room of the world’s largest economy. Modern carbon accounting is rarely about virtue; it is fundamentally about industrial geography and thermal dependency.
States do not pollute because their citizens wake up with malicious intent. They pollute because our global modern civilization demands petrochemical refining, grid-stabilizing baseload power, steel fabrication, agricultural nitrogen fertilizers, and heavy freight transportation.
The historical playbook is catching up with us. Just as old industrial powerhouses learned during the transition from coal to steam, when you build physical manufacturing assets with 30-year depreciation cycles, you cannot instantly dismantle them with four-year political mandates. As the old proverb warns: “You do not tear down the old bridge until the new one is built to carry the load.”
The Unequal Burden: Coastal Sanctuaries vs. Heartland Foundries
Consider the top tier of American state emissions from 2025:
-
Texas (682 MMT): The refining heart of the Western Hemisphere and the bedrock of American energy exports.
-
California (345 MMT): The hyper-regulated powerhouse whose clean-tech facade relies on imported power and massive supply-chain logistics.
-
Florida (220 MMT): A service, logistics, and tourism economy driven by relentless commercial refrigeration and thermal air conditioning.
-
Pennsylvania (215 MMT): The shale capital and legacy coal foundry navigating a messy industrial grid reboot.
-
Illinois (180 MMT): The central freight and aviation turnstile of North America, reliant on hybrid nuclear-fossil corridors.
-
Ohio (175 MMT): Traditional metalworking, automotive foundries, and heavy polymer fabrication.
-
New York (160 MMT): Commercial density, urban transit logistics, and older residential heating networks.
-
Michigan (145 MMT): The industrial vehicle supply chain grappling with the physical realities of EV production.
-
Georgia (140 MMT): Logistics hubs, expanding server farm footprints, and Southeastern transit corridors.
-
Indiana (135 MMT): High-density blast furnaces, heavy freight corridors, and concentrated manufacturing.
Contrast these heavy hitters with the bottom tier: Vermont (7 MMT), Wyoming (6 MMT), Alaska (8 MMT), and North Dakota (9 MMT). While small populations or legacy non-industrial terrain artificially deflate the totals of the lowest states, the gulf is stark. Texas emits nearly 100 times more carbon than Vermont and Wyoming put together.
To demand that Indiana (135 MMT) and Vermont (7 MMT) adhere to identical, linear carbon-reduction timetables is not smart policy; it is economic vandalism. It transfers capital from production centres to financial capitals, leaving local factory workforces high and dry.
Global Benchmarks: The Mirror to India, Europe, and East Asia
This American distribution exposes a critical lesson for developing economic superpowers, specifically India and emerging giants across the Global South.
Take India’s Vision 2030 and Vision 2047. As India pushes its industrial manufacturing share of GDP toward 25% under modern production-linked incentive schemes, the country faces the exact same structural friction. You cannot build high-speed rail, expand deep-sea ports, and construct millions of urban dwellings out of thin air.
Steel and cement require intense heat and specific chemical reactions; they inevitably emit carbon until green hydrogen reaches economic parity.
When Western regulatory frameworks attempt to impose mechanisms like the European Union’s Carbon Border Adjustment Mechanism (CBAM), they deliberately ignore how heavy manufacturing works on the ground. Let us look at how the world’s leading economies handle this divide:
-
United States (Tier-1): Fractured governance. Blue coastal states mandate rooftop solar and electric fleet integration, while red interior states extract hydrocarbons, subsidize pipeline corridors, and export refined fuel to the rest of the world.
-
Germany (Tier-1): A cautionary tale. Prematurely shutting down operational nuclear facilities forced their heavy industrial sector giants like BASF and Thyssenkrupp to rely on imported gas, run reserve coal plants, or offshore high-emission jobs to the US and China.
-
Japan (Tier-1): Resource-poor and pragmatically conservative. Japan relies on thermal coal and imported LNG to keep its auto and electronics hubs alive, while slowly recommissioning nuclear units to protect its industrial base.
-
China (Tier-2 Powerhouse): Realpolitik in action. China commissions more renewable capacity than any other nation while simultaneously approving dozens of gigawatts of new coal baseload power to guarantee uninterrupted manufacturing for global markets.
-
India (Benchmark Comparison): Balancing survival and progress. India has scaled renewable installations rapidly, but it rightly maintains thermal baseload power to drive growth. India’s per capita emissions remain under 2.5 metric tons, a fraction of the US average of over 14 metric tons.
Expecting industrializing economies to choke their own growth while a single state like Texas (682 MMT) runs an emission engine larger than entire continents is both unrealistic and unfair.
The Complete 50-State Industrial Reality Check
The following comprehensive dataset breaks down the estimated 2025 emissions across all 50 states, detailing their primary industrial drivers and real-world structural bottlenecks.
| State | Emissions (MMT CO2e, 2025 est.) | Dominant Economic Driver | Structural Decarbonization Bottleneck |
| Texas | 682 | Petrochemical refining, Oil & Gas, Heavy Transport | Deep chemical heat, export refining infrastructure |
| California | 345 | Commercial Transport, Agriculture, Urban Centers | Grid intermittency, heavy vehicle charging demand |
| Florida | 220 | Aviation, Logistics, Continuous Cooling Demand | Extreme baseload air conditioning, natural gas grid |
| Pennsylvania | 215 | Fracking, Steel Manufacturing, Industrial Coal/Gas | Legacy industrial infrastructure, heavy thermal energy |
| Illinois | 180 | Intermodal Rail, Aviation, Heavy Agriculture | Long-haul logistics hubs, seasonal agricultural drying |
| Ohio | 175 | Automotive Manufacturing, Primary Metals | Heavy metallurgical coal/gas reliance in blast furnaces |
| New York | 160 | Commercial Real Estate, Transport, Financial Hubs | Legacy building heating retrofits, dense grid constraints |
| Michigan | 145 | Automotive Assembly, Heavy Tooling, Freight | Battery supply chain processing, legacy manufacturing |
| Georgia | 140 | Air Transport (ATL Hub), Warehousing, Forestry | Rapid server farm expansion, regional transit hubs |
| Indiana | 135 | Steel Production, Foundries, Agricultural Processing | Heavy blast furnace dependencies, coal-to-gas transition |
| North Carolina | 130 | Technology Hubs, Textiles, Freight Corridors | Massive data center baseload, rapid population inflow |
| Louisiana | 125 | LNG Export Terminals, Petrochemicals, Refining | High-temperature chemical synthesis, deepwater ports |
| Washington | 120 | Aerospace Manufacturing, Technology, Shipping | Aviation fuels, clean hydro limits reached |
| Virginia | 110 | Global Data Center Corridors, Defense Logistics | Northern Virginia data center power consumption |
| Tennessee | 105 | Automotive Plants, Logistics, Consumer Goods | Rapid industrialization, supply-chain trucking |
| Arizona | 100 | Semiconductor Fabs, Mining, Cooling Demand | Water-energy nexus, intensive cooling for fabs |
| Massachusetts | 95 | Bio-pharma, University Hubs, Dense Residential | Old building stock heating, high reliance on imported LNG |
| Missouri | 90 | Agricultural Machinery, Freight, Aerospace | Legacy coal grid conversion, midwestern intermodal freight |
| Maryland | 85 | Maritime Shipping, Logistics, Federal Infrastructure | Port operations, urban highway congestion |
| Wisconsin | 80 | Dairy Processing, Heavy Machinery, Paper Mills | High-heat drying and manufacturing processes |
| Colorado | 75 | Oil & Gas Extraction, Aviation, Tourism Transit | Mountainous freight logistics, extraction footprint |
| Minnesota | 70 | Agriculture, Iron Ore Mining, Food Processing | Sub-zero heating demands, energy-heavy taconite processing |
| South Carolina | 65 | Automotive Exports, Aerospace Assembly, Ports | Port expansion emissions, automotive manufacturing power |
| Alabama | 60 | Steel Mills, Shipbuilding, Automotive Assembly | Legacy heavy thermal manufacturing |
| Kentucky | 55 | Aluminum Smelting, Automotive, Logistics | Extreme electric baseload demands for smelting |
| Oklahoma | 50 | Oil & Gas Production, Pipeline Infrastructure | Pipeline compression stations, wind curtailment limits |
| Connecticut | 45 | Precision Machining, Submarine Yards, Suburbs | High regional power prices, residential heating oil |
| Oregon | 40 | Microchips, Forestry, Technology Centers | High industrial fab energy, long transit distances |
| Iowa | 38 | Industrial Corn/Soy, Meat Processing, Fertilizer | Agricultural nitrous oxide and high livestock intensity |
| Utah | 36 | Mining, Data Infrastructure, Freight Rail | Mineral extraction, high-altitude logistics |
| Kansas | 35 | Aviation Manufacturing, Agriculture, Cattle | Agricultural feedlots, long-range freight networks |
| Nevada | 34 | Hospitality, Lithium Mining, Warehousing | Air conditioning baseload, mining equipment electrification |
| Arkansas | 32 | Steel Mini-mills, Retail Logistics, Poultry | Specialized steel electric arc baseload requirements |
| Mississippi | 30 | Shipbuilding, Petrochemicals, Agriculture | River transport, agricultural runoff and processing |
| Nebraska | 28 | Cattle Ranching, Meatpacking, Rail Corridors | High energy-density refrigeration and food processing |
| New Mexico | 26 | Permian Basin Drilling, Defense Research | Methane venting/flaring, remote extraction operations |
| Hawaii | 24 | Aviation Logistics, Maritime Freight, Tourism | Island grid constraints, high reliance on shipped fuels |
| West Virginia | 22 | Coal Mining, Chemical Manufacturing | Transition resistance, thermal baseload dependencies |
| Idaho | 20 | Food Processing, Semiconductor Research, Ag | Seasonal food dehydration, agricultural logistics |
| New Hampshire | 18 | Light Manufacturing, Residential Heating | Wood and oil heating, cold winter temperature profiles |
| Maine | 16 | Forestry, Maritime, Residential Heating | High reliance on home heating oil, rural transit miles |
| Rhode Island | 14 | Marine Trade, Urban Transit, Light Industrial | Dense residential heating, coastal shipping emissions |
| Montana | 12 | Ranching, Mining, Long-haul Freight | Low population density but immense transit distances |
| Delaware | 11 | Chemical Research, Poultry, Commercial Transport | Freight trucking corridors, agricultural processing |
| South Dakota | 10 | Agriculture, Ethanol Refineries, Financial Hubs | High energy inputs for bio-refining and grain handling |
| North Dakota | 9 | Bakken Shale, Agriculture, Winter Heating | High per-capita energy use, extreme winter survival power |
| Alaska | 8 | Oil Extraction, Remote Aviation, Marine Transport | Isolated microgrids, diesel reliance in severe arctic cold |
| Vermont | 7 | Artisanal Goods, Tourism, Agriculture | Minimal heavy industry, high reliance on hydro imports |
| Wyoming | 6 | Coal Extraction, Soda Ash Mining, Rail Shipping | Raw energy exports, low in-state consumer base |
| Total | 5,600 MMT | World’s Largest Capitalist Economy | Deep, Unyielding Base Industrial Load |
(The Harsh Reality): Over 60% of America’s emissions are anchored in non-negotiable physical processes—smelting, refining, heavy intermodal transport, and seasonal thermal survival. Green paper offsets do not eliminate physical emissions; they merely push them across state and national borders.
The “So What?” Factor: The Ripple Effect on Wall Street and Main Street
When raw carbon emissions sit at 5,600 MMT, every regulatory tweak, carbon tax, or green subsidy sends massive shockwaves through household budgets and investment portfolios.
1. The Everyday Household: The Regressive Energy Surcharge
When states like Indiana (135 MMT) or Ohio (175 MMT) are pressured to shut down coal and gas plants ahead of schedule, utility companies pass billions in grid upgrade and replacement costs directly to consumers.
The working-class family in Cleveland or Indianapolis does not have spare capital for rooftop solar arrays, whole-home battery backup, or luxury EVs. They bear the brunt of rising electricity rates.
Furthermore, because energy powers all agriculture and transport, every increase in fossil fuel compliance costs shows up directly at the supermarket checkout.
2. The Mid-Market Industrialist: Capital Allocation Paralysis
If you operate a medium-sized precision foundry in Michigan (145 MMT) or an extrusion plant in Pennsylvania (215 MMT), your cost of capital is climbing. Commercial banks, bound by ESG compliance and institutional lending mandates, are hiking interest margins on emission-intensive facilities.
Factory owners face a tough dilemma: spend $20M to $50M on experimental electric furnaces that the local grid cannot reliably support, or shut down entirely and relocate operations across the border to Mexico or Southeast Asia.
3. The Institutional Investor: Stranded Asset Anxiety
Institutional funds holding industrial municipal debt or energy infrastructure assets are in an uncomfortable position. Pipeline operators in Louisiana (125 MMT) and refinery assets across Texas (682 MMT) continue to throw off strong free cash flows.
Yet, these assets trade at discounted valuation multiples because markets fear punitive future regulations. Smart money is taking advantage of this disconnect: harvesting high double-digit dividend yields from traditional energy infrastructure, while using green subsidies as speculative upside plays rather than reliable core investments.
Seasonality and Anomaly Alert: Structural Reality or Cyclical Mirage?
Do not let short-term quarterly dips fool you. Politicians love to point to an annual drop in national emissions as proof that their green policies are working. But a close look at the data reveals that these fluctuations are often driven by simple economics and weather patterns, not permanent structural shifts:
-
The Post-Industrial Illusion: Emissions reductions in states like New York (160 MMT) or Illinois (180 MMT) frequently stem from factory closures rather than clean tech breakthroughs. When a factory closes in the Rust Belt and reopens in Vietnam or Indonesia, global emissions do not drop. They rise, because Asian grids are typically more carbon-intensive. Shifting emissions overseas is not decarbonization; it is carbon arbitrage.
-
Weather-Driven Spikes and Dips: Florida’s 220 MMT footprint is directly tied to cooling degree days. A scorching summer in the American South spikes air conditioning demand, pushing natural gas turbines to their limits. Conversely, a mild winter in the Northeast suppresses heating oil demand in Maine (16 MMT) and Massachusetts (95 MMT), making carbon numbers look artificially green.
-
The Data Center and Artificial Intelligence Surge: A major anomaly reshaping the balance sheet is the boom in artificial intelligence and hyperscale computing. In states like Virginia (110 MMT), Georgia (140 MMT), and North Carolina (130 MMT), emissions from power generation are climbing. Power grids are running natural gas turbines flat out to keep massive data centers running 24/7. Clean solar and wind simply cannot deliver the continuous, uninterrupted baseload power these computing facilities demand.
The Two-Sided Risk Assessment: Bull vs. Bear Case
Navigating this transition requires looking past ideological debates and examining the balance sheet on both sides.
The Bull Case: The High-Tech Industrial Renaissance
-
Electrification Sparks Industrial Rebirth: Massive federal incentives create a strong domestic market for high-grade electrical steel, grid-scale batteries, and next-generation nuclear power (Small Modular Reactors).
-
Early Capitalization on Clean Tech: States like Texas leverage abundant sun, wind, and vast open land to build a massive green hydrogen and solar network, decarbonizing their refining clusters while maintaining their spot as top energy exporters.
-
Reshoring with Low-Carbon Efficiency: Advanced robotics and automated manufacturing allow new American factories to run cleanly and outcompete dirty, coal-heavy overseas competitors on absolute energy efficiency.
-
Private Capital Inflows: Trillions of dollars in institutional capital move from speculative paper assets into real, productive green infrastructure, boosting domestic manufacturing and high-paying technical jobs.
The Bear Case: Premature Grid Failure and De-Industrialization
-
Premature Baseload Decommissioning: Retiring natural gas and coal plants before utility-scale storage is proven causes frequent brownouts and rolling blackouts across the Midwest and Southern manufacturing corridors.
-
Capital Flight and Loss of Critical Jobs: Heavy industries, crushed by uncompetitive local utility rates, pack up and move abroad, taking critical supply chains and high-paying industrial jobs with them.
-
Spiraling Public Debt and Subsidies: Trillions in taxpayer subsidies for wind, solar, and EV assembly plants strain national finances without delivering an energy system capable of weathering extreme cold snaps or heatwaves.
-
Consumer Backlash: Spiraling power bills, expensive electric heat pumps, and costly vehicle mandates trigger a deep political backlash, unwinding decarbonization policies and creating a decade of regulatory gridlock.
The Alternative Scenario: What if Policy Reverses Overnight?
What happens if public pushback against high energy prices triggers an abrupt reversal of environmental mandates over the next several years?
If zero-emission mandates are rolled back and fossil infrastructure projects are fast-tracked, the domestic energy picture shifts dramatically:
-
Natural Gas Dominance Locked In: The Appalachian and Permian basins will double down on low-cost fracking. Plentiful, affordable domestic gas would secure a massive cost advantage for domestic manufacturers over European and Asian competitors.
-
Nuclear Becomes the True Winner: Rather than betting entirely on weather-dependent solar and wind, capital will flow toward long-life, high-density nuclear baseload power. This offers a sensible compromise: round-the-clock reliability for heavy industry with zero operational emissions.
-
Regional Specialization Replaces National Targets: States will stop chasing blanket federal targets. High-emission industrial hubs will focus on practical, cost-effective carbon capture and process improvements, while coastal service states pursue localized efficiency. This lowers compliance costs and protects the domestic supply chain.
My Verdict: The Hard Roadmap for 2026, 2030, and 2047
Looking out at the next twenty years, the data makes the path forward clear. The easy gains in decarbonization such as switching power generation from dirty thermal coal to cheaper, cleaner natural gas are largely complete in the United States.
The road ahead requires untangling the deeply embedded emissions in our core manufacturing and industrial supply chains.
The Immediate Horizon (2026–2030): Pragmatism Over Green Dogma
The current friction in the power grid will force a pragmatic rethink across Western policy circles. The growing power demands of artificial intelligence, automated manufacturing, and consumer electrification will prevent the hasty retirement of natural gas baseload generation. States like Texas (682 MMT), Pennsylvania (215 MMT), and Louisiana (125 MMT) will continue to serve as the critical energy anchors of the Western world.
For developing nations like India, this period must be used to aggressively build out domestic energy infrastructure without bowing to external pressures that would limit economic growth. India should continue expanding its balanced energy mix: rapidly installing solar where it makes economic sense, while securing its heavy industrial manufacturing hubs with dependable coal, gas, and nuclear power.
The Centennial Horizon (2030–2047): The Nuclear and High-Density Era
By 2047 the centenary of Indian independence and the benchmark for modern global industrial maturity true decarbonization will not be achieved by cutting back consumption or chasing feel-good carbon offsets. It will be won through clean, reliable, high-density energy: next-generation nuclear power, deep geothermal, and cost-effective hydrogen for heavy chemical manufacturing.
Nations that sacrifice their core manufacturing base on the altar of premature green targets will find themselves economically hollowed out, dependent on foreign suppliers for the basic materials of modern life. True strategic autonomy and genuine long-term environmental sustainability come from mastering energy physics, respecting industrial realities, and building resilient economies capable of funding real technical breakthroughs.
Stop evaluating energy systems based on good intentions. Start evaluating them by the physical realities of the grid, the balance sheets of essential industries, and the everyday cost of living for working families.
GOOGLE ‘PEOPLE ALSO ASK’ FAQs
Q1: Which US state has the highest carbon emissions?
A1: Texas produces 682 MMT CO2e, representing 12.18% of total US emissions. Its output surpasses the combined annual emissions of the UK and France due to heavy petrochemical refining, natural gas infrastructure, and freight logistics.
Q2: What percentage of total US emissions comes from the top 10 states?
A2: 43.1% (2,417 MMT CO2e) of the national 5,600 MMT total originates from just 10 states. These regional industrial hubs concentrate heavy metallurgical, refining, and manufacturing processes that cannot run on intermittent renewables alone.
Q3: Why do industrial US states produce significantly more emissions than coastal states?
A3: Over 60% of industrial emissions stem from high-heat thermal processing, blast furnaces, and chemical synthesis that lack scalable electric alternatives. Service-oriented coastal economies export their physical production footprints to interior manufacturing hubs while relying on imported grid power.
Q4: How do US state emissions compare to India’s carbon output?
A4: Under 2.5 metric tons is India’s annual per capita emission rate, compared to over 14 metric tons per person in the United States. While US aggregate volume sits at 5,600 MMT, India maintains lower baseline intensity despite scaling industrial manufacturing toward its Vision 2047 target.
Q5: What is the projected economic risk of premature fossil plant retirements by 2030?
A5: $20M to $50M in equipment conversion costs per mid-sized foundry threatens heavy manufacturing with capital flight and grid instability by 2030. Decommissioning reliable thermal baseload power before grid-scale nuclear or storage matures leads to severe power price spikes for consumers.
Data Source
- U.S. Energy Information Administration (EIA
- State Energy Data System (SEDS)
- U.S. Environmental Protection Agency (EPA)
- Inventory of U.S. Greenhouse Gas Emissions and Sinks
- International Energy Agency (IEA)
- World Energy Balances.
Disclaimer: This report is for informational and analytical purposes only and does not constitute formal financial, investment, or policy advice.