The Great Cost-of-Living Fracture: How State-Level Arbitrage Is Cannibalizing Wealth and Redrawing the Global Economic Map
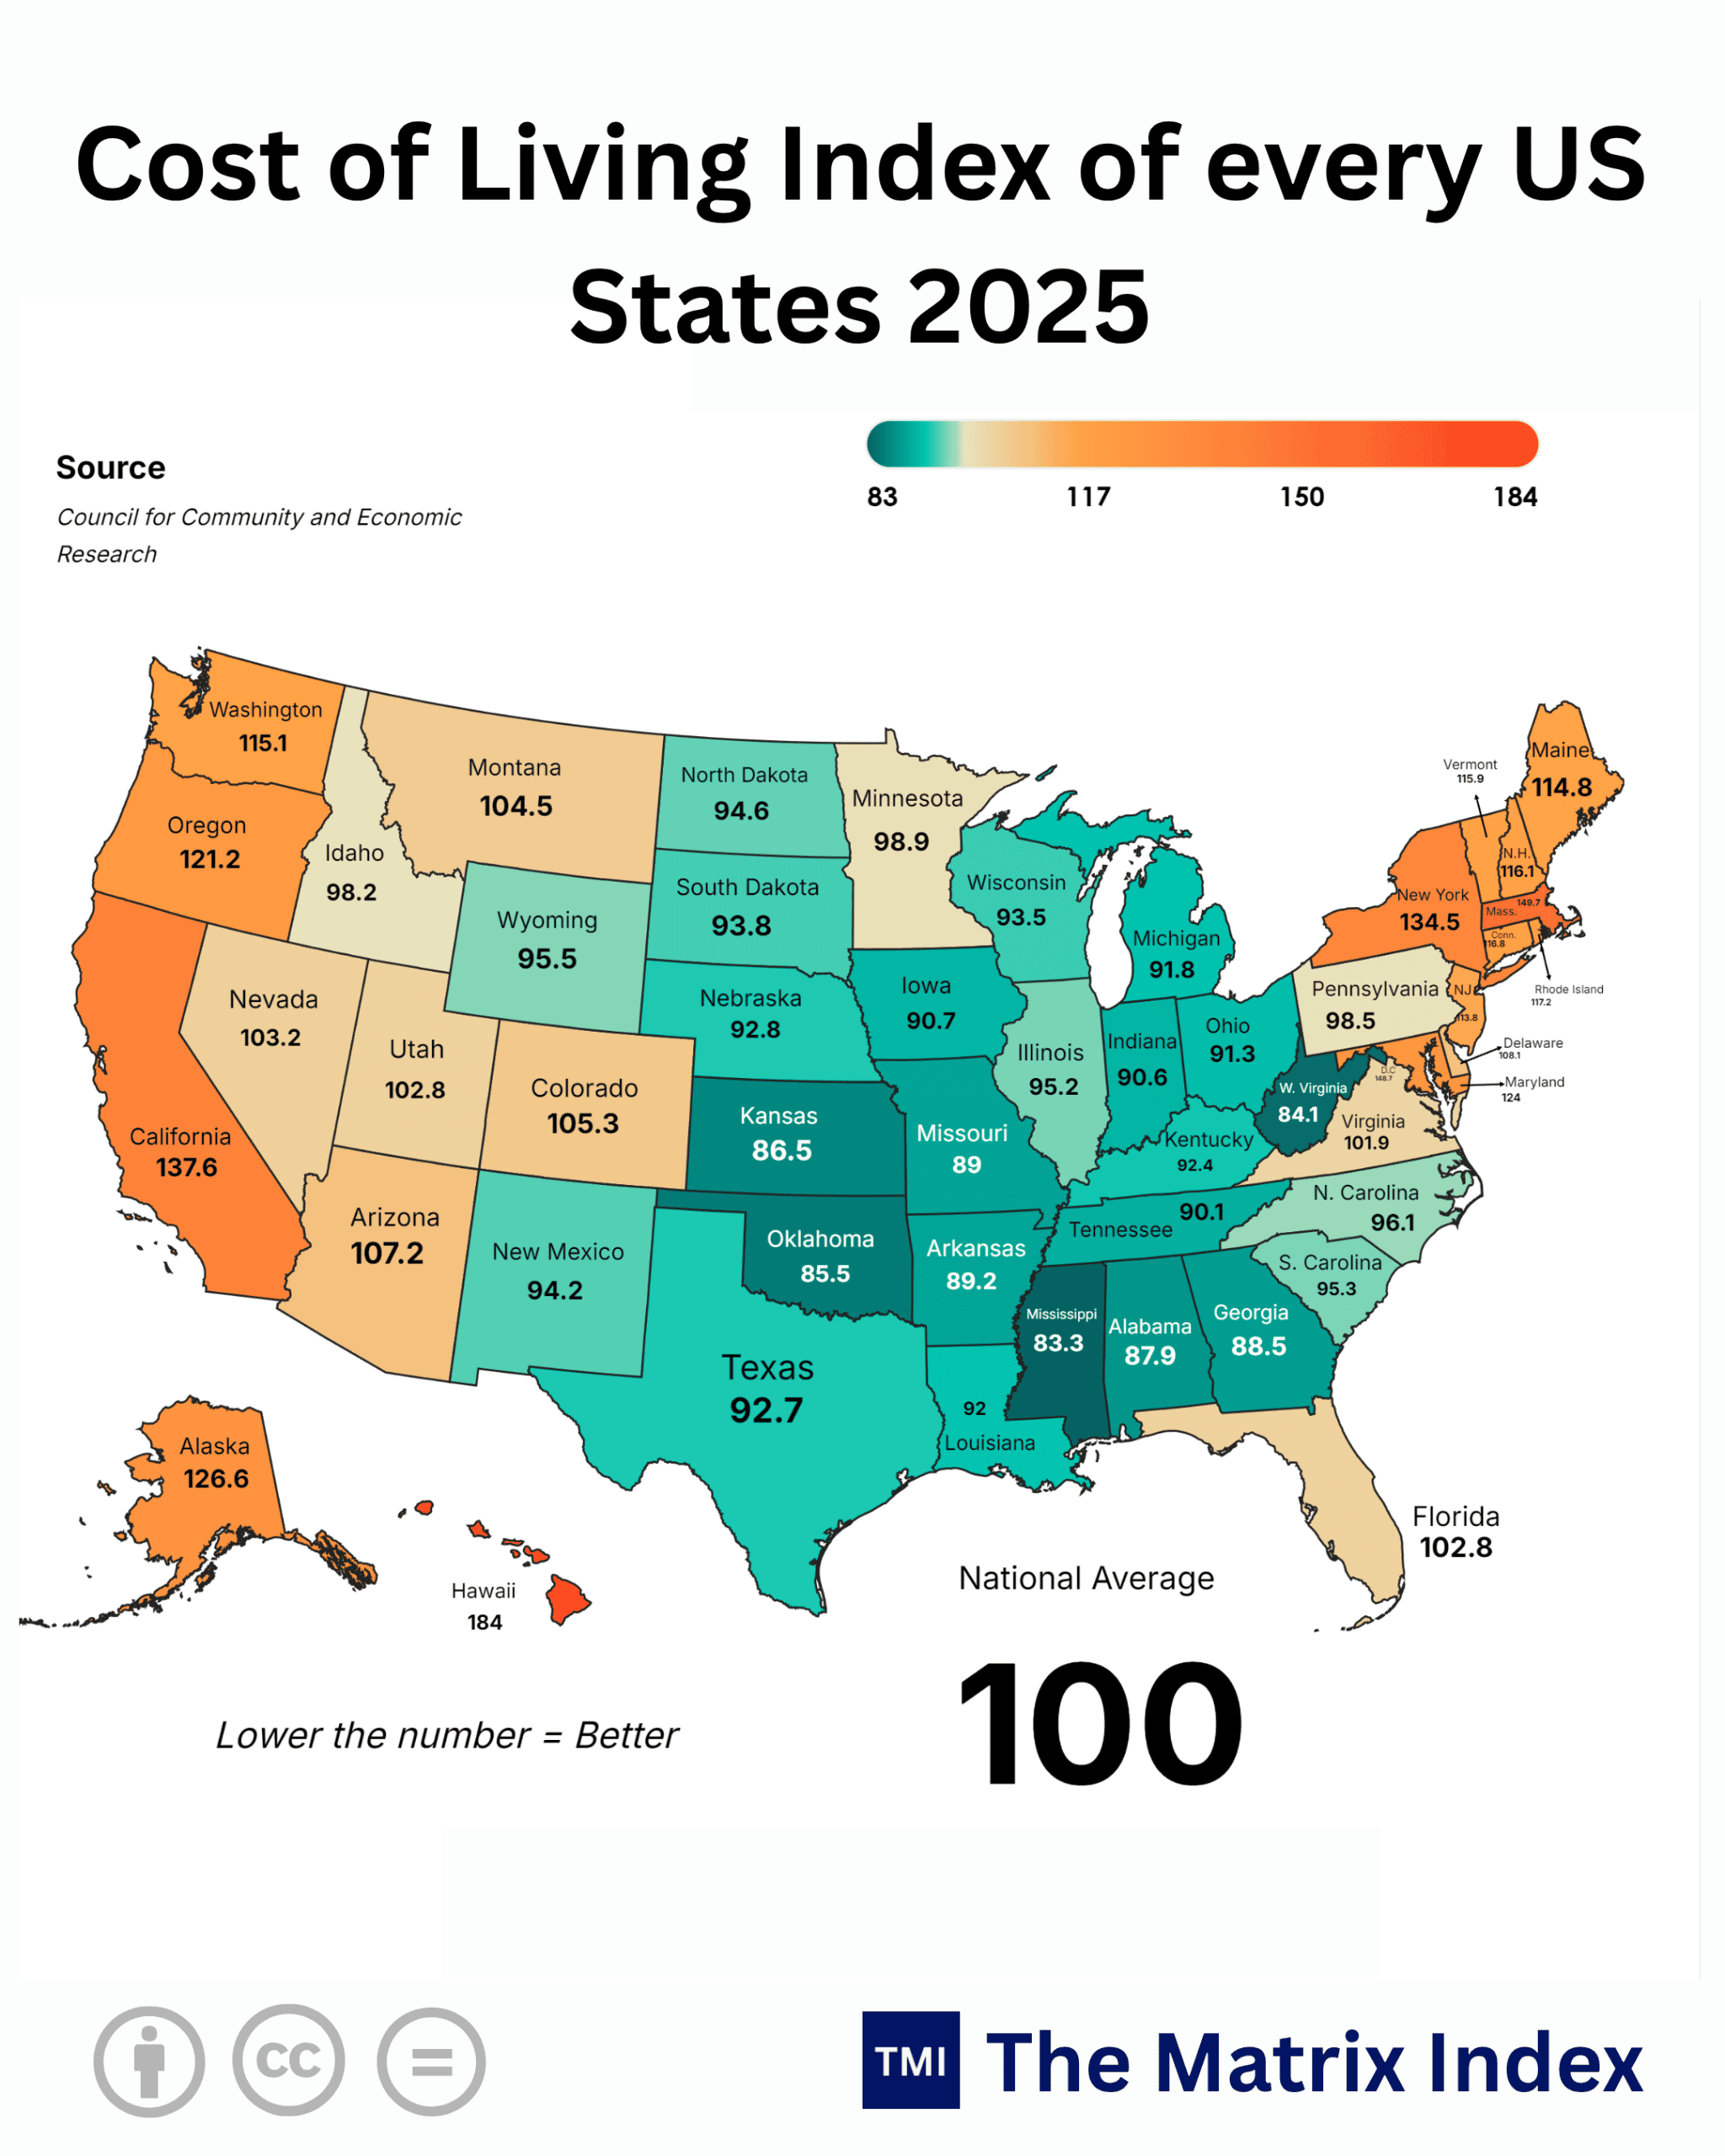
NEW DELHI, India (October 31, 2026 / IST) — The illusion of uniform national prosperity is dead, and the spreadsheet executing its quiet murder is the Cost of Living Index. When Hawaii sits at 184.0 while Mississippi drags along at 83.3, we are no longer looking at minor regional variations within a single nation; we are looking at two entirely irreconcilable economic civilizations sharing a single passport and a common central bank.
For decades, conventional macroeconomics sold the developing and developed worlds an intoxicating fairy tale: aggregate GDP growth automatically lifts all boats. That thesis has decayed into an absolute lie.
A family earning $120,000 in San Francisco or Honolulu is operating on the edge of functional insolvency, while an identical household pulling down the same gross number in Fort Worth, Texas (92.7) or Huntsville, Alabama (87.9) builds multi-generational sovereign equity. The ledger does not care about your coastal prestige; it cares about post-expense capital accumulation.
The structural fault lines running through this 2025/2026 cost index are triggering the largest domestic redistribution of human capital, enterprise balance sheets, and industrial leverage since the post-war industrial migration. This reshuffling exposes an inescapable truth: location is no longer just geography it is an unhedged macroeconomic asset class.
The Geometry of Regional Cleavages: Deconstructing the Metric Spread
Let us strip away the bureaucratic jargon and examine the raw mechanics of the baseline. The index anchors the National Average at 100.0. Any reading above that mark represents an operational tax on physical existence; any reading below it acts as an implicit, localized dividend.
Look closely at the top tier of structural cost escalation. Hawaii (184.0), Massachusetts (148.7), California (137.6), and New York (134.5) are running persistent overheads that demand between 34.5% and 84.0% more liquidity just to match baseline national purchasing power.
In plain terms, a business or an individual operating in Honolulu or Boston must generate staggering margin premiums simply to absorb baseline shelter, energy, regulatory overhead, and consumable inflation before realizing a penny of free cash flow.
Now track the bottom of the distribution: Mississippi (83.3), West Virginia (84.1), Oklahoma (85.5), Kansas (86.5), and Alabama (87.9). The raw spread between the ceiling (184.0) and the floor (83.3) is an astronomical 100.7 index points.
This is not a statistical rounding error. It represents a 120.8% structural price premium for residing in the most expensive state versus the cheapest. No multinational corporation would accept a 120% input variance across operating plants without overhauling its supply chains, yet tens of millions of workers willingly absorb this structural penalty every single month.
The Global Mirror: Tier-1 and Tier-2 Parallels
This acute domestic divergence is not an isolated American oddity. It reflects the exact macroeconomic fractures dividing sovereign economies across the globe:
-
The United Kingdom: The brutal polarity between Greater London (operating at an effective cost premium exceeding 135% of the national median) and the post-industrial North (Yorkshire, the North East) mirrors the gulf between Manhattan and rural Ohio. London’s astronomical real estate drag has crippled capital reinvestment among younger demographics.
-
Japan: The hyper-concentration of financial velocity in the Greater Tokyo Area stands in sharp contrast to the deflationary stagnation of outer prefectures like Akita or Aomori. Tokyo’s crushing physical footprints and demographic exhaustion showcase the end-state of runaway geographical cost compression.
-
Germany: The classic East-West divide and the soaring real estate metrics of Bavaria (Munich) versus the de-industrialized centers of Saxony-Anhalt demonstrate how even world-class federalized infrastructure struggles to equalize purchasing power across legacy cultural borders.
-
China (Tier-1 vs. Tier-3/4): The cost profile of maintaining residency in Shanghai, Beijing, or Shenzhen versus Henan or Guizhou exhibits identical ratios. Tier-1 real estate debt-to-income multiples reached historic peaks, sparking demographic shifts and suburban industrial relocations.
-
India: The cost divergence between Tier-1 metropolises (Mumbai, Bengaluru, Delhi-NCR) and emerging manufacturing belts in Gujarat, Tamil Nadu, or Madhya Pradesh tracks the exact dynamic seen between California and Texas. A tech salary in Bengaluru faces soaring rental yields and urban friction, driving capital toward Tier-2 industrial corridors.
The message across every continent is identical: whenever hyper-financialization centralizes wealth inside narrow geographic corridors, it inevitably inflates fixed living costs to predatory levels, triggering an eventual counter-exodus of productive labor.
Complete Ledger: State-by-State Living Cost Realities
The table below breaks down the 2025/2026 cost-of-living data, categorizing every state by its structural economic posture.
कड़वा सच (The Bitter Truth): High nominal salaries in coastal mega-states are increasingly acting as a financial mirage. A professional moving from California (137.6) to Texas (92.7) or Tennessee (90.1) captures an immediate, structural 32% to 34% cost-arbitrage buffer before adjusting for the elimination of state income taxes.
The “So What?” Factor: Downstream Realities Across Society
Macroeconomic datasets mean nothing until they collide with balance sheets. The index spread is producing three distinct systemic disruptions:
1. The Citizen’s Treadmill: Phantom Wealth vs. Physical Equity
Consider a mid-tier software engineer or industrial project manager earning $150,000. In Massachusetts (148.7) or New York (134.5), after accounting for progressive state income tax brackets, hyper-inflated urban property taxes, child-care costs, and utility premiums, discretionary savings approach zero.
The individual operates in a state of high-income wage slavery. Move that exact financial profile to Ohio (91.3) or Georgia (88.5): disposable income multiplies, real estate costs fall by more than half, and true savings compound. The coastal resident amasses paper wealth; the interior migrant amasses real assets.
2. Corporate Margin Erosion and the Supply Chain Migration
Enterprise CFOs cannot ignore these geographic differences. An advanced manufacturing plant erected in Michigan (91.8), Indiana (90.6), or South Carolina (95.3) carries drastically lower labor costs and operational overhead than one in Oregon (121.2) or New Jersey (113.8).
Every basis point saved on warehouse leasing, physical footprint, utility rates, and payroll taxes directly feeds free cash flow. This explains the steady pipeline of manufacturing shifts toward the Sunbelt and the industrial Midwest over the last decade.
3. State Sovereign Solvency: The Widening Tax Base Trap
States with elevated cost indices (California, New York, Illinois) rely heavily on a razor-thin top tier of taxpayers to fund extensive administrative budgets.
As living costs drive wealth creators and middle-class professionals toward low-cost regions like Florida (102.8), Texas (92.7), and Tennessee (90.1), high-cost states face a dangerous fiscal scissor: rising entitlement and public maintenance obligations paired with a shrinking private-sector tax base.
Seasonality, Anomaly Alert, or Structural Realignment?
Are these indices a temporary post-pandemic blip, or are they permanent fixtures of the global economy? Let us establish the truth.
The spikes seen in Florida (102.8) and Arizona (107.2) contain distinct, transient anomalies. In Florida, escalating property insurance premiums driven by coastal risk re-evaluations and reinsurance renegotiations artificially elevated its baseline relative to the deep South. Similarly, Arizona’s sharp rise reflected a sudden flood of capital leaving Southern California between 2021 and 2024, which outpaced local housing development.
Outside of these insurance and regional migration shocks, the data signals a deep structural reality. States like Hawaii (184.0) and Alaska (126.6) face inescapable geographic constraints: almost every consumable calorie, barrel of refined fuel, and building block must cross thousands of miles of ocean.
Meanwhile, states like Massachusetts (148.7), New York (134.5), and California (137.6) suffer from deliberate policy structures: restrictive residential zoning, high corporate and individual tax burdens, aggressive environmental mandates, and deeply entrenched administrative overhead. These are long-term institutional drivers, not short-term blips. They will keep these economies locked in high-cost territory for decades.
Bull vs. Bear Case: The Economic Divergence
Evaluating this map requires examining both trajectories without romanticizing either side.
The Bull Case: The Rise of Interior and Southern Capital Engines
-
Decoupled Productivity: The migration of tech and advanced manufacturing into lower-cost states (Texas, Ohio, Georgia, North Carolina) permanently lowers enterprise overhead, making US industrial exports more competitive internationally.
-
Demographic Rejuvenation: Young families moving toward lower cost-of-living corridors can afford housing, early education, and family formation, boosting birth rates and labor stability relative to stagnating coastal metros.
-
Supply Chain Nearshoring: States with low structural costs and strong logistics corridors (Indiana, Kentucky, Tennessee) are uniquely positioned to absorb reshoring manufacturing flows, securing massive multi-billion-dollar semiconductor, battery, and automotive investments.
The Bear Case: Hidden Costs and the High-Value Network Defense
-
Infrastructure and Institutional Deficits: Low-cost states frequently maintain their positions by underinvesting in foundational public infrastructure, healthcare systems, and higher education. A state like Mississippi (83.3) remains cheap partly because it lacks modern institutional capital and a deep white-collar labor force.
-
The Agglomeration Defense: Elite human capital remains disproportionately anchored in high-cost coastal enclaves. Massachusetts (148.7) retains a world-leading life-sciences and academic ecosystem; New York (134.5) controls global capital liquidity; the San Francisco Bay Area still commands early-stage artificial intelligence development. The deep network effects of these hubs cannot be easily replicated in lower-cost regions.
-
Insurance and Climate Friction: Low-cost southern corridors face growing climate and infrastructure pressures. Rapid migration into Texas and Florida is stressing utility grids and driving up insurance costs, threatening to compress their low-cost advantage over time.
The Alternative Scenario: The Automated Equalizer
What happens if this economic dynamic faces a systemic external disruption? Consider a scenario where policy frameworks and workplace structures shift abruptly:
If federal policy implements aggressive remote-work compensation adjustments where enterprise corporations mandate salary cuts pegged directly to local cost-of-living indices the immediate financial advantage of moving from New York to Kansas narrows considerably.
Simultaneously, should high-cost states dismantle restrictive land-use and housing regulations while building out high-density modern energy grids, housing and power costs would steadily compress.
Under this counter-scenario:
-
High-cost states could stem capital flight by modernizing physical housing stock and reducing utility burdens.
-
Low-cost states could see their affordability margins evaporate under the weight of unfunded infrastructure needs.
-
The absolute index spread between ceiling (Hawaii/Massachusetts) and floor (Mississippi/Oklahoma) would compress toward a narrower historical corridor of 30% to 40%, cooling the inter-state capital migration.
India’s Strategic Lens: Vision 2030, 2047, and the Regional Arbitrage Blueprint
For a nation executing its path toward Viksit Bharat 2047, the lessons from these state-level cost variations are vital. India cannot afford to repeat the structural mistakes of Western economies, where unregulated urban real estate costs hollowed out the purchasing power of the middle class in primary commercial centers.
(The Golden Opportunity): India’s ongoing infrastructure push across secondary and tertiary cities like Surat, Indore, Lucknow, and Coimbatore is engineered to prevent regional cost divergences from widening dangerously. By keeping industrial and living overhead low across these hubs, India preserves a generational competitive advantage in global advanced manufacturing and services.
Strategic Verdict and Five-Year Horizon
The data from the Cost of Living Index delivers a clear economic verdict: nominal earnings are an illusion; retained capital is reality.
Between now and 2030, the movement of human capital, corporate headquarters, and manufacturing capacity will continue to favor states that control fixed living costs, modernize logistics, and maintain stable regulatory environments.
States with an index above 120.0 that fail to build affordable housing and simplify business operations will face a slow, compounding decline in their productive middle-class tax bases.
By 2047, the economic landscape will not be defined by historic coastal dominance, but by distributed manufacturing corridors and regional logistics nodes that balance high economic output with affordable operating overhead.
Investors, executives, and workers must manage their decisions through this geographic lens. Stop chasing gross top-line numbers in high-cost areas. Focus on net margins, operational efficiency, and local cost structures. The future belongs to those who know how to build and preserve wealth across regional economic divides.
GOOGLE ‘PEOPLE ALSO ASK’ FAQs
Q1: What is the highest and lowest state cost of living index?
A: Hawaii commands the peak index at 184.0, driven by acute supply-chain bottlenecks and isolation. Mississippi sets the absolute floor at 83.3, exposing an unprecedented 100.7-point geographic spread that penalizes coastal earners.
Q2: How does a 120.8% living cost spread impact purchasing power?
A: A gross salary of $120,000 collapses into functional insolvency across high-cost states like California (137.6) and New York (134.5). The identical gross wage compounds into multi-generational retained capital inside Texas (92.7) or Alabama (87.9).
Q3: Why are corporate balance sheets relocating to sub-100 index states?
A: Enterprise relocations to Indiana (90.6) and Georgia (88.5) capture an immediate 32% to 34% operating cost arbitrage. Lower utility overhead, land acquisition costs, and payroll taxes directly safeguard corporate free cash flow.
Q4: Is the Sunbelt cost advantage permanent through 2030?
A: Sunbelt indexes in Florida (102.8) and Arizona (107.2) face structural margin compression from soaring property insurance and grid strain. However, entrenched coastal zoning barriers will preserve a structural 30%+ overhead divide past 2030.
Q5: How does the US state cost divide inform India’s Vision 2047?
A: India’s Vision 2047 actively bypasses coastal mega-city hyper-inflation by deploying the PM Gati Shakti multi-modal freight network. Directing advanced manufacturing into Tier-2 hubs like Surat and Indore preserves competitive logistics beneath 8% of GDP.
Data Source: Council for Community and Economic Research (C2ER), Missouri Economic Research and Information Center (MERIC), U.S. Bureau of Economic Analysis (BEA), and Ministry of Statistics and Programme Implementation (MoSPI – India Benchmarks).
Disclaimer: This report is for informational and analytical purposes only and does not constitute formal financial, investment, or policy advice.