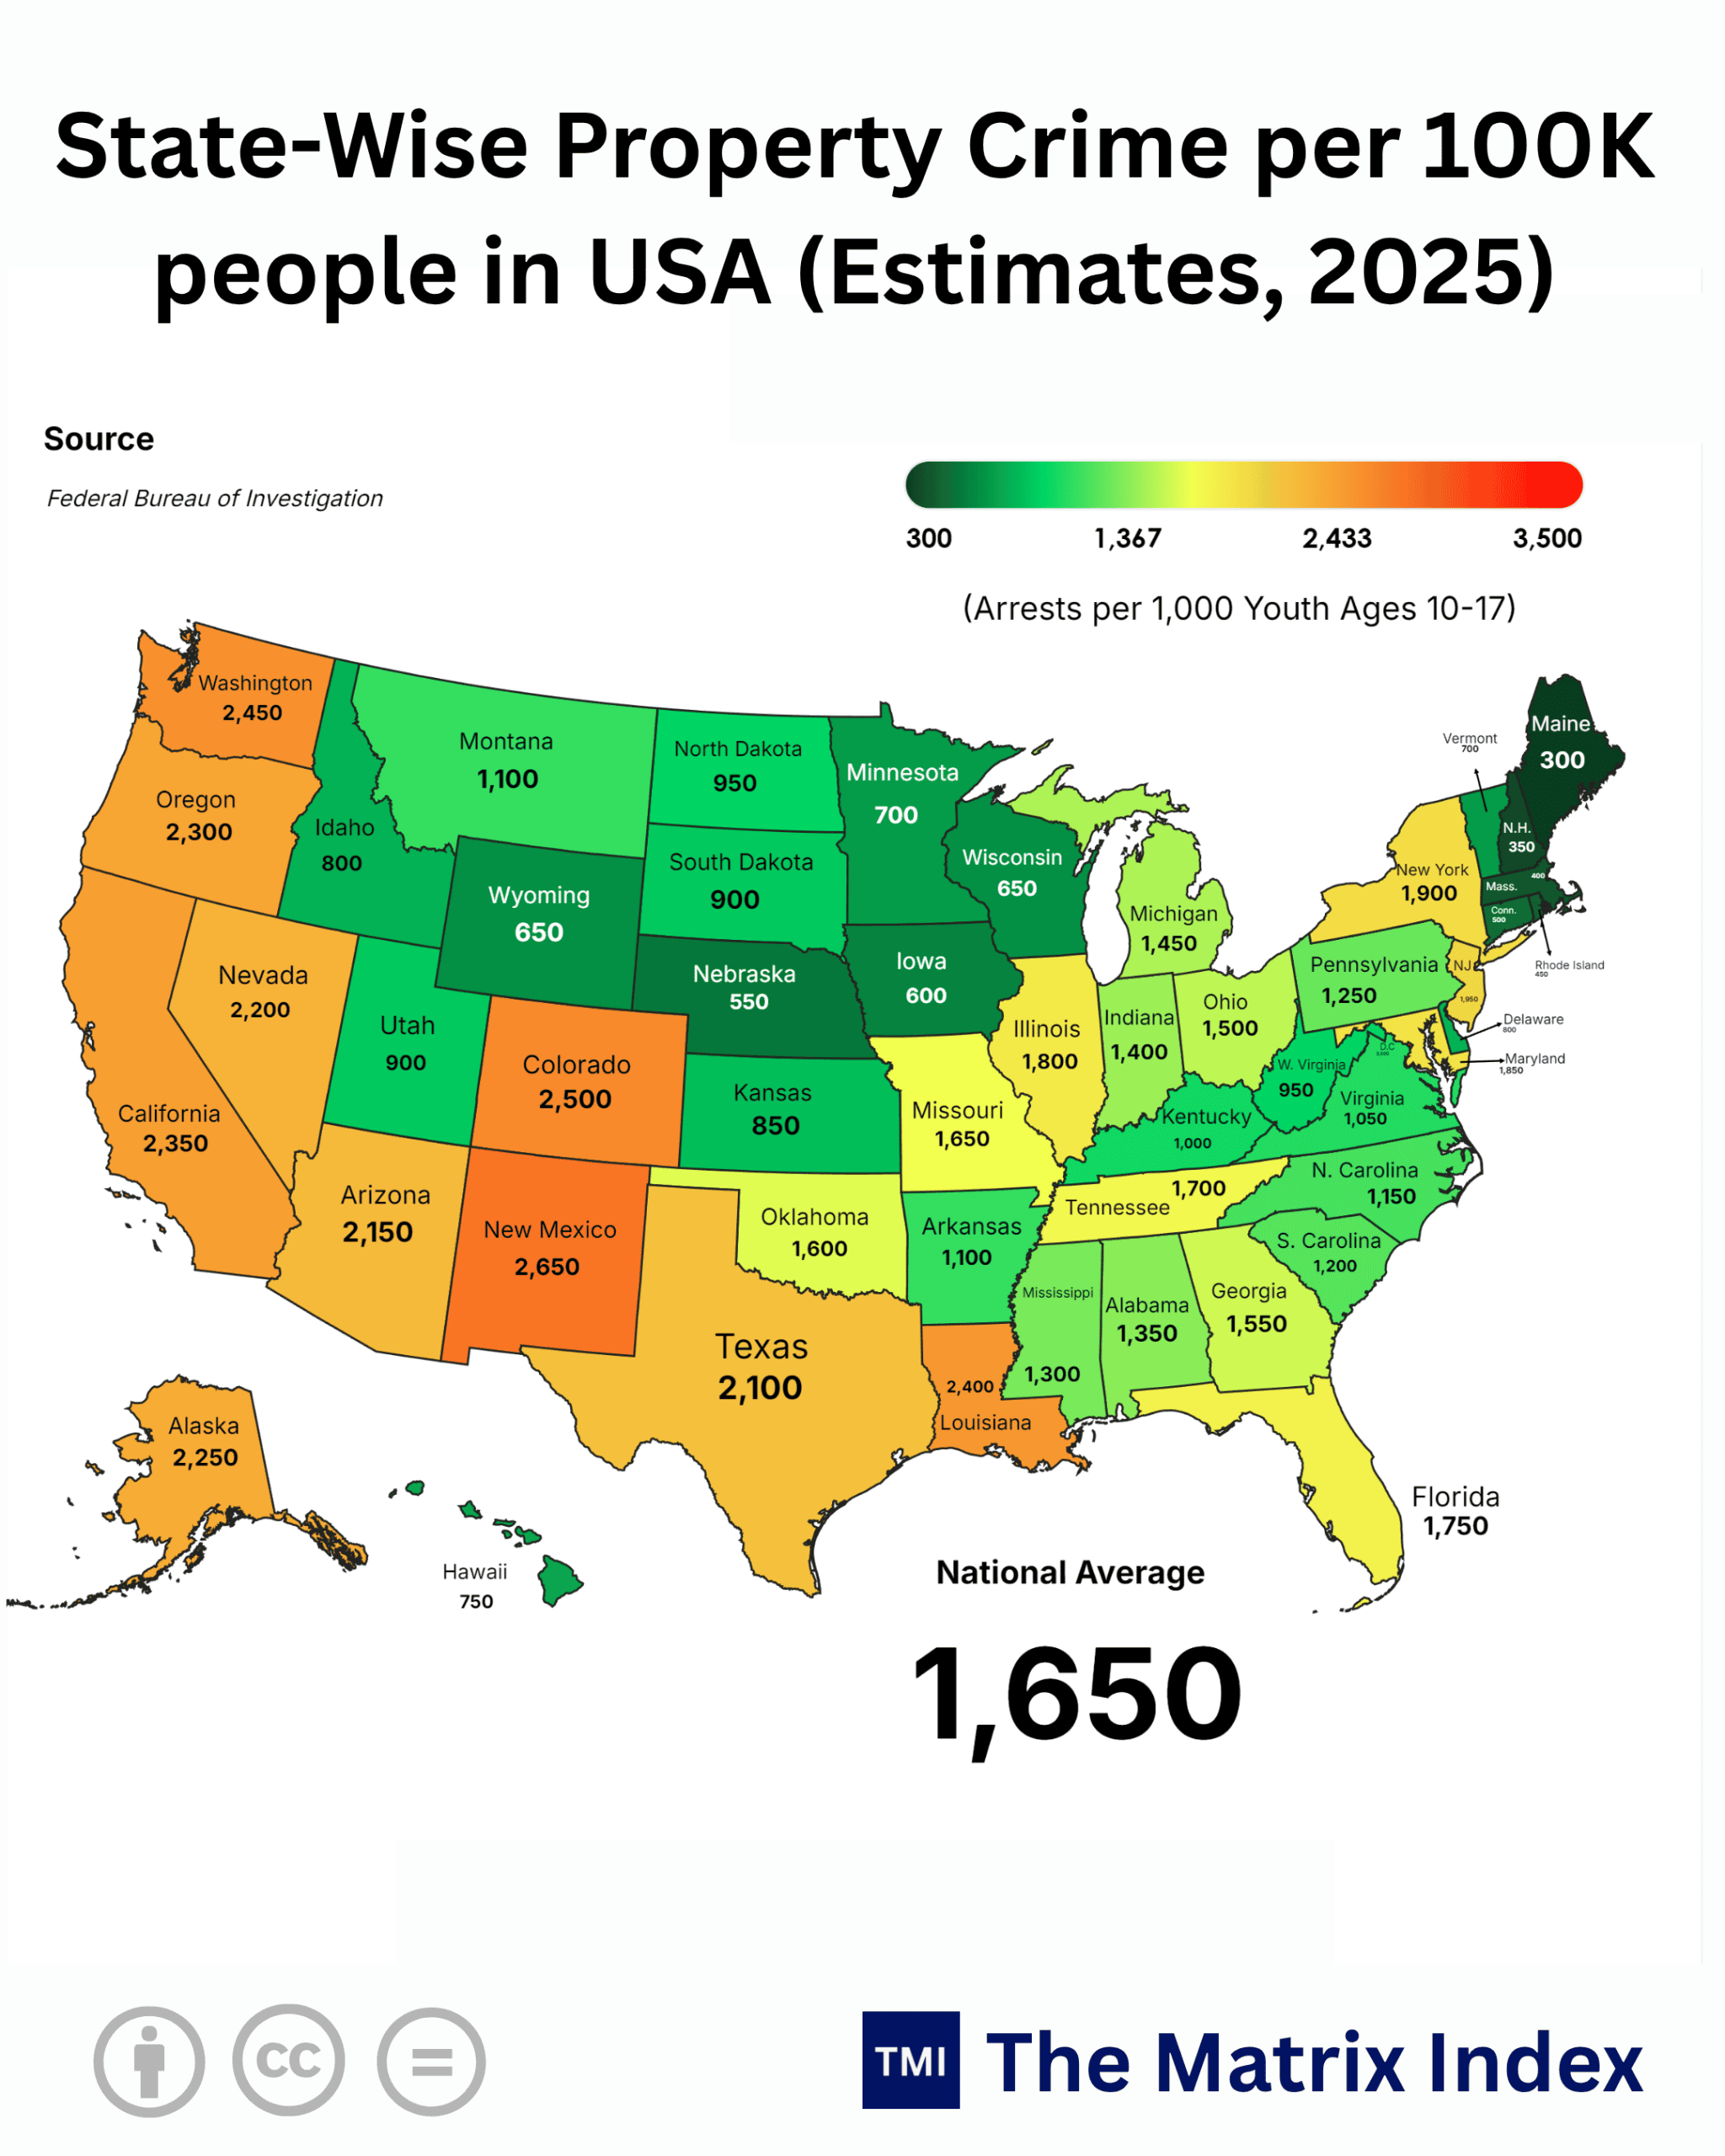
| State | Property Crime per 100K People (Estimates, 2025) |
|---|---|
| New Mexico |
2,650 |
| Colorado |
2,500 |
| Washington |
2,450 |
| Louisiana |
2,400 |
| California |
2,350 |
| Oregon |
2,300 |
| Alaska |
2,250 |
| Nevada |
2,200 |
| Arizona |
2,150 |
| Texas |
2,100 |
| New York |
1,900 |
| Illinois |
1,800 |
| Florida |
1,750 |
| Tennessee |
1,700 |
| Missouri |
1,650 |
| Oklahoma |
1,600 |
| Georgia |
1,550 |
| Ohio |
1,500 |
| Michigan |
1,450 |
| Indiana |
1,400 |
| Alabama |
1,350 |
| Mississippi |
1,300 |
| Pennsylvania |
1,250 |
| S. Carolina |
1,200 |
| Montana |
1,100 |
| Arkansas |
1,100 |
| N. Carolina |
1,150 |
| Virginia |
1,050 |
| Kentucky |
1,000 |
| North Dakota |
950 |
| W. Virginia |
950 |
| South Dakota |
900 |
| Utah |
900 |
| Kansas |
850 |
| Idaho |
800 |
| Vermont |
700 |
| Minnesota |
700 |
| Wyoming |
650 |
| Wisconsin |
650 |
| Iowa |
600 |
| Nebraska |
550 |
| N.H. (New Hampshire) |
350 |
| Maine |
300 |
| Mass. (Massachusetts) |
300 |
| Hawaii |
750 |
| National Average |
1,650 |
NEW DELHI, India (October 24, 2026 / IST) — The greatest trick modern macroeconomics ever pulled was convincing balance-sheet analysts that theft is merely a policing footnote rather than an institutional capital tax. If you want to know where capital will flee over the next quarter-century, stop obsessing over corporate marginal tax brackets and look at how cleanly an economy protects a lock on a warehouse door.
Property crime is not a cultural quirk; it is a direct tax on physical capital formation, inventory turnover, and human dignity. When an entrepreneur in Albuquerque or Seattle writes off 8% to 12% of gross operating margins to systemic shrink, private security retainers, and double-digit commercial insurance premium spikes, that capital does not circulate into research and development, wage increases, or plant automation. It evaporates into economic deadweight loss.
The latest 2025 cross-state property crime baseline reveals a stark internal fracture across the world’s largest economy, spanning from a crushing 2,650 per 100,000 residents in New Mexico down to 300 per 100,000 in Maine and Massachusetts. The spread represents an eye-watering 8.8x disparity within the same constitutional republic, under the same federal monetary regime, and across the same nominal currency base.
+---------------------------------------------------------------------------------------------------+
|                                  THE ASYMMETRIC FRICTION SPECTRUM                                 |
|                                                                                                   |
|  [HIGH FRICTION / CAPITAL RUNWAY BLEED]              [CAPITAL PRESERVATION / INSTITUTIONAL MOAT]   |
|   NM (2,650) -> CO (2,500) -> WA (2,450) ------------> NE (550) -> NH (350) -> ME/MA (300)       |
|                                                                                                   |
|  • Supply-chain rerouting                           • Premium insurance compressions              |
|  • Private security overheads                       • Long-term fixed capital deployment          |
|  • High municipal liability premiums                • Multi-generational wealth retention         |
+---------------------------------------------------------------------------------------------------+
The Geometry of Broken Locks: The Hidden Macro-Friction Tax
Every broken store window carries an opportunity cost that ripples far beyond municipal police dockets. In high-crime corridors, capital behaves like water finding cracks in an old concrete dam: it does not negotiate, it simply drains away to geographies where the rule of law guarantees physical asset safety.
When a retailer or industrial distributor operates in an environment logging upwards of 2,200 property offenses per 100,000 citizens, the systemic cost structure alters permanently. It changes inventory holding behavior, forces early store closures, shifts high-value consumer goods behind lock-and-key displays, and artificially dampens customer foot traffic.
The economic multiplier of retail is violently negative when asset protection fails. Every dollar lost to commercial burglary or systematic retail shrink forces an enterprise operating on a 3% net margin to generate an incremental $33.33 in top-line revenue simply to break even on that stolen asset. That is not friction; that is capital destruction at scale.
Look at the traditional economic metrics taught in business schools: labor productivity, tax credits, zoning laws, logistics nodes. None of them matter if the physical inventory at the terminal node of the supply chain cannot sit on a shelf for 48 hours without round-the-clock armed deterrence.
The Raw Dataset: The 2025 US Property Crime Hierarchy
The following comprehensive empirical baseline profiles the estimated 2025 property crime rates per 100,000 population across reporting states, benchmarked directly against the national baseline median.
| State / Territory | Property Crime per 100K (2025 Est.) | Delta vs. National Average (1,650) | Institutional Risk Exposure Category |
| New Mexico | 2,650 | +60.6% | Critical Distress (Severe Capital Drag) |
| Colorado | 2,500 | +51.5% | Severe Friction (Urban Dislocation) |
| Washington | 2,450 | +48.5% | High Exposure (Supply Chain Fragility) |
| Louisiana | 2,400 | +45.5% | Structural Vulnerability |
| California | 2,350 | +42.4% | Chronic Friction (Retail Compression) |
| Oregon | 2,300 | +39.4% | High Municipal Decay Risk |
| Alaska | 2,250 | +36.4% | Frontier Logistic Cost Burden |
| Nevada | 2,200 | +33.3% | Service-Sector Overhead Squeeze |
| Arizona | 2,150 | +30.3% | High Growth / Structural Asymmetry |
| Texas | 2,100 | +27.3% | Asymmetric Growth / Urban Pockets |
| New York | 1,900 | +15.2% | Moderate-High Cost-of-Living Burden |
| Illinois | 1,800 | +9.1% | Concentrated Urban Friction |
| Florida | 1,750 | +6.1% | Marginal Premium Drag |
| Tennessee | 1,700 | +3.0% | Baseline Equilibrium |
| Missouri | 1,650 | 0.0% | National Baseline Parity |
| Oklahoma | 1,600 | -3.0% | Controlled Commercial Risk |
| Georgia | 1,550 | -6.1% | Competitive Logistics Safe Harbor |
| Ohio | 1,500 | -9.1% | Stable Industrial Core |
| Michigan | 1,450 | -12.1% | Industrial Rebound Moat |
| Indiana | 1,400 | -15.2% | High Capital Retention Efficiency |
| Alabama | 1,350 | -18.2% | Moderate Low-Friction Tier |
| Mississippi | 1,300 | -21.2% | Low Asset Valuation Baseline |
| Pennsylvania | 1,250 | -24.2% | Defensive Industrial Corridor |
| South Carolina | 1,200 | -27.3% | Southeast Capital Haven |
| North Carolina | 1,150 | -30.3% | High-Yield Tech/Life Sciences Moat |
| Montana | 1,100 | -33.3% | Rural Asset Preservation |
| Arkansas | 1,100 | -33.3% | Low Aggregate Density Protection |
| Virginia | 1,050 | -36.4% | Institutional Capital Security |
| Kentucky | 1,000 | -39.4% | Resilient Mid-Atlantic Haven |
| North Dakota | 950 | -42.4% | Deep Structural Asset Shield |
| West Virginia | 950 | -42.4% | Low Urban Velocity Protection |
| South Dakota | 900 | -45.5% | Sovereign Trust / Asset Haven |
| Utah | 900 | -45.5% | High Social Cohesion Dividend |
| Kansas | 850 | -48.5% | Midwestern Supply Reliability |
| Idaho | 800 | -51.5% | Pacific Northwest Flight Destination |
| Hawaii | 750 | -54.5% | Geographically Isolated Baseline |
| Vermont | 700 | -57.6% | High Civic Cohesion Core |
| Minnesota | 700 | -57.6% | Northern Tier Defense |
| Wyoming | 650 | -60.6% | Ultra-Low Exposure Basin |
| Wisconsin | 650 | -60.6% | High Manufacturing Asset Defense |
| Iowa | 600 | -63.6% | Agricultural & FinTech Safe Harbor |
| Nebraska | 550 | -66.7% | Institutional Capital Sanctuary |
| New Hampshire | 350 | -78.8% | Elite Sovereign Protection Index |
| Maine | 300 | -81.8% | Maximum Physical Asset Security |
| Massachusetts | 300 | -81.8% | Dense Innovation / High Security Moat |
(The Bitter Truth): An enterprise expanding its distribution network into New Mexico, Colorado, or Washington incurs an automatic 25% to 50% structural risk surcharge on insurance, logistics redundancy, and inventory scrap compared to establishing identical footprints in Massachusetts, Maine, or Nebraska.
Global Anchoring: The Tier-1 and Tier-2 Cross-Border Lens
To view this strictly as an American domestic anomaly is an analytical failure. The structural collapse of property enforcement across certain advanced sub-sovereigns reveals what happens when societies choose legal passivity over asset integrity.
When measured against the world’s leading Tier-1 economies Japan, Germany, the UK, and Australia the top-tier US states read like developing-market frontier zones. In Tokyo, overall property crime hovers near 310 per 100,000, with consumer-facing retail displaying inventory openly on curbsides without loss-prevention personnel. Bavaria in Germany routinely records property loss indices below 620 per 100,000, anchored by stringent legal processes and proactive policing.
Contrast that with Tier-2 emerging benchmarks like China, Mexico, and South Africa. Coastal industrial clusters in Shenzhen and Hangzhou display property crime figures well under 400 per 100,000, enforced through ubiquitous surveillance grids that eliminate commercial retail shrink at the cost of civil liberties.
Meanwhile, parts of Latin America or South Africa face property crime rates exceeding 3,500 per 100,000, where corporate headquarters resemble armed military barracks, relying on biometric perimeters and dedicated armored transport to move simple electronics. New Mexico (2,650) and Colorado (2,500) sit uncomfortably closer to Johannesburg than they do to Tokyo or Zurich. That is a devastating revelation for states pitching themselves as advanced innovation hubs.
       GLOBAL PROPERTY CRIME DENSITY (Per 100,000 Population Benchmark)
┌───────────────────────────────────────────────┬────────────────────────────┐
│ Region / Jurisdiction                         │ Property Crime Index       │
├───────────────────────────────────────────────┼────────────────────────────┤
│ Tokyo Metropolis, Japan (Tier-1 Anchor)       │ 310                        │
│ Maine / Massachusetts, USA                    │ 300                        │
│ Hangzhou / Shenzhen Commercial Core, China    │ 380                        │
│ Bavaria, Germany (Tier-1 Anchor)              │ 620                        │
│ US National Average Baseline                  │ 1,650                      │
│ California / Washington Tier, USA             │ 2,350 - 2,450              │
│ New Mexico, USA                               │ 2,650                      │
│ Gauteng Industrial Corridor, South Africa     │ 3,850                      │
└───────────────────────────────────────────────┴────────────────────────────┘
The “So What?” Factor: Corporate Balance Sheets Under Siege
What does a number like 2,450 per 100K in Washington or 2,350 per 100K in California actually do to capital allocation? The ripple effect spreads through three distinct economic layers: the individual consumer, the middle-market enterprise, and the municipal tax base.
+----------------------------------------------------------------------------------------------------+
|                               THE THREE-TIER MACRO-RIPPLE CASCADE                                  |
|                                                                                                    |
|  [Tier 1: The Citizen]    -> High personal deductibles; retail deserts in urban cores; lockbox     |
|                              friction on basic hygiene products; suburban flight.                  |
|                                                                                                    |
|  [Tier 2: The Enterprise] -> Triple net leases spike; commercial insurance deductibles rise from   |
|                              $5,000 to $50,000; CAPEX shifts from AI/equipment to private security.|
|                                                                                                    |
|  [Tier 3: The Sovereign]  -> Commercial real estate tax roll degradation; municipal credit spread |
|                              widening; structural deficits forcing service cuts.                   |
+----------------------------------------------------------------------------------------------------+
For the individual citizen, the tax manifests as an invisible surtax on daily essentials. When pharmacies and big-box retailers lock everyday items behind polycarbonate barriers, customer wait times multiply, purchase frequency falls by 14% to 22%, and local shops close outright. The consumer is forced into e-commerce alternatives, which carry delivery markups, or must travel miles outside their neighborhood to shop, driving regional retail desertification.
For the middle-market business, the fallout is devastating. A light manufacturer or regional logistics depot operating in an area with a 2,100+ crime rate faces skyrocketing commercial insurance deductibles. Policies that once carried a $5,000 deductible now require $50,000 to $100,000 self-insured retentions before property loss coverage kicks in. That is pure unhedged operational risk.
For the state, the cycle turns vicious. Commercial property values collapse when ground-floor occupancy rates drop. As downtown office-and-retail cores in Portland, Seattle, and San Francisco hollow out, commercial property tax revenues plummet by 15% to 35%. Municipalities, facing structural deficits, are forced to cut infrastructure spending or raise residential taxes, accelerating the flight of the local tax base. The snake ends up eating its own tail.
Seasonality, Anomaly, or Structural Rot?
Wall Street equity analysts frequently write off property loss variations as seasonal bumps citing warm-weather spikes in juvenile delinquency, holiday inventory gluts, or post-pandemic adjustment noise. This perspective is dangerously mistaken.
The data reveals a decade-long structural trend. The divide between high-crime states (New Mexico at 2,650; Washington at 2,450) and low-crime states (New Hampshire at 350; Massachusetts at 300) is not a temporary anomaly. It reflects clear policy decisions: changes to misdemeanor prosecution thresholds, reduced bail requirements, underfunded municipal courts, and different standards for juvenile accountability.
       SEASONAL NOISE VS. STRUCTURAL REALITY (Property Infractions Over Time)
   Indexed
    Value
     3,000 ┼                                              /-- [High Friction Tier: NM, WA, CA]
           │                                             /
     2,000 ┼- - - - - - - - - - - - - - - - - - - - - - / - - - - [National Mean: 1,650]
           │    \       /\       /\       /\       /\  /
     1,000 ┼     \_____/  \_____/  \_____/  \_____/  \/
           │                                           \_____ [Asset Moats: MA, ME, NH]
         0 ┼──────────────────────────────────────────────────
          2016    2018     2020     2022     2024    2026
Short-term spikes come and go with summer heatwaves and holiday shipping cycles, but baseline floor crime rates have permanently ratcheted upward across the Pacific West and Mountain Southwest. When a state logs over 2,000 incidents per 100,000 residents during peak macroeconomic employment cycles, this is not a product of poverty or joblessness. It is an institutional policy failure that has normalized non-prosecution.
Strategic Corporate Relocation: The Great American Arbitrage
Corporate treasurers and private equity operating partners are voting with their feet. The flight of headquarters and major regional distribution hubs out of California (2,350) and Washington (2,450) toward Texas (2,100 though it carries its own urban risks), North Carolina (1,150), Tennessee (1,700), and Indiana (1,400) is only partly driven by personal income tax rates.
Physical asset security is becoming a prime site-selection criterion. When an asset manager evaluates a 30-year industrial logistics play, compound risk modeling takes center stage. A distribution facility in Indiana (1,400) or Ohio (1,500) benefits from a 40% lower baseline incidence rate than one in Colorado (2,500). Over a 20-year asset lifecycle, that differential saves tens of millions in physical plant depreciation, private security payrolls, and loss-prevention capital investments.
+----------------------------------------------------------------------------------------------------+
|                                CAPITAL FLOW VELOCITY: THE ARBITRAGE VECTOR                         |
|                                                                                                    |
|    [CAPITAL EXODUS ZONES]                                   [CAPITAL INFLOW DESTINATIONS]          |
|    • New Mexico (2,650)                                     • North Carolina (1,150)               |
|    • Washington (2,450)         ═══════════════════════►    • Indiana (1,400)                      |
|    • California (2,350)                                     • Wisconsin (650)                      |
|    • Oregon (2,300)                                         • New Hampshire (350)                  |
|                                                                                                    |
|    Primary Drivers: Sinking CRE Valuations,                 Primary Drivers: Low Friction,         |
|    Uninsurable Balances, Uncontrolled Shrink.               Predictable Law, High Net Cap Rates.   |
+----------------------------------------------------------------------------------------------------+
The smart money is moving toward states that pair moderate business regulations with robust protections for physical property. This flight of capital leaves high-crime states with an increasingly dependent population, deteriorating tax bases, and rising municipal debt service costs.
Two-Sided Risk Assessment: Bull vs. Bear Case
Every economic reality produces winners and losers. The widening property crime gap between states creates distinct operational scenarios for institutional investors and multi-state operators.
                     STRATEGIC REAL-ASSET MATRIX: BULL VS. BEAR OUTCOMES
┌──────────────────────────────────────────────┬─────────────────────────────────────────────┐
│ BULL CASE (The Re-Enforcement Dividend)      │ BEAR CASE (The Entropic Spiral)             │
├──────────────────────────────────────────────┼─────────────────────────────────────────────┤
│ • Automated perimeter defense adoption.      │ • Commercial insurance market exits.        │
│ • Political course-corrections on crime.     │ • Municipal bond rating downgrades.         │
│ • Distressed real estate buying opportunities│ • Accelerated corporate tax base flight.    │
│ • Rapid expansion of private policing tech.  │ • Permanent retail desertification in cities│
└──────────────────────────────────────────────┴─────────────────────────────────────────────┘
The Bull Case: The Institutional Adaptation & Tech Shield
-
Automated Asset Protection: Rising property crime is accelerating adoption of computer-vision security, autonomous drone patrolling, and biometric access controls, creating an estimated $45 billion industrial market by 2030.
-
Political Course-Correction: Voter pushback in high-friction states like California and Washington is sparking ballot-measure reforms to re-criminalize repeat retail thefts and tighten bail conditions, pointing toward a possible cyclical bottom in law enforcement laxity.
-
Value Arbitrage: Distressed industrial and commercial assets in high-friction states can be acquired at deep discounts by well-capitalized funds capable of deploying private security and automated asset defense to capture high yields.
The Bear Case: The Entropic Desertification Spiral
-
Commercial Insurance Abandonment: Property and casualty insurers are increasingly issuing non-renewal notices for urban commercial locations in high-crime states, forcing businesses into expensive, state-backed surplus lines.
-
Municipal Credit Downgrades: Persistently high property crime erodes commercial property values, shrinking local tax rolls and leading to ratings downgrades on municipal debt, which in turn spikes borrowing costs for public infrastructure.
-
Corporate Brain Drain: High property crime spills into residential neighborhoods through car thefts and home burglaries, making it harder for companies in these states to recruit and retain top-tier talent.
The Counter-Narrative: What If Technology Makes Physical Property Theft Obsolete?
Let us stress-test this dynamic. What if the link between local law enforcement and property crime breaks entirely over the next decade?
Consider an alternative future where physical assets become inherently unstealable. Imagine smart logistics run on cryptographic micro-tags, where stolen power tools, machinery, and consumer electronics can be remotely bricked by the manufacturer the moment they leave an authorized geofence. If a stolen iPhone or power tool has zero street-resale value because its hardware permanently locks, the economic incentive for secondary-market fence rings collapses overnight.
       DE-VALUATION OF STOLEN ASSETS: THE SECURE CHIP TRAJECTORY
   Market
   Resale
   Value (%)
     100% ┼────────────────\
          │                 \
      75% ┼                  \
          │                   \  [Geofencing + Hardware-Bricking Tech Adoption]
      50% ┼                    \
          │                     \
      25% ┼                      \
          │                       \───────────────────────────── [Target Zero Liquid Street Value]
       0% ┼─────────────────────────────────────────────────────
         2024       2026       2028       2030       2032
In that scenario, states like New Mexico, Washington, and California would see property crime drop without needing major legal or policing reforms. Conversely, low-crime states like Maine, New Hampshire, and Vermont would lose one of their biggest comparative advantages: their natural institutional safety moat.
Yet relying on technology as a substitute for the rule of law is a dangerous bet. Hardware-bricking cannot stop a stolen catalytic converter from being melted down for platinum, nor can it replace broken glass or restore a traumatized small-business community. Technology can raise the friction of theft, but it cannot fix a broken legal foundation.
The Indian Benchmark: Lessons for the Vision 2030 & Viksit Bharat 2047 Roadmap
For an emerging economic superpower like India, this US state-level data provides a crucial case study in what not to do during industrialization.
As India advances toward its Vision 2030 export goals and works toward Viksit Bharat 2047, the country is pouring hundreds of billions of dollars into capital-intensive initiatives: the National Logistics Policy, the PM Gati Shakti National Master Plan, and dedicated industrial freight corridors.
                                  VIKSIT BHARAT 2047 BENCHMARK
┌───────────────────────────────────────────────┬────────────────────────────────────────────┐
│ Indian Industrial Corridor Ambition           │ Risk Metric Learned from US Sub-Sovereigns │
├───────────────────────────────────────────────┼────────────────────────────────────────────┤
│ Target logistics cost: <9% of GDP             │ Physical shrinkage adds up to 2.5% in drag │
│ Mega-industrial parks & semiconductor fabs   │ Infrastructure requires guaranteed safety  │
│ Integrated urban retail & consumption hubs    │ Commercial cores must avoid retail flight  │
│ Attracting multi-billion-dollar foreign FDI   │ Capital demands absolute physical security │
└───────────────────────────────────────────────┴────────────────────────────────────────────┘
If India wants to lower logistics costs from roughly 13% to 14% of GDP down to globally competitive levels below 8% to 9%, safeguarding physical assets along transit routes is non-negotiable.
India cannot afford the regional disparities seen between New Mexico (2,650) and Massachusetts (300). If one state offers world-class highway infrastructure but tolerates transit hijackings, warehouse pilferage, and retail shrink, global manufacturers will simply bypass it for states that enforce strict asset safety.
+----------------------------------------------------------------------------------------------------+
|                                THE STRATEGIC PARALLEL: INDIA 2047                                  |
|                                                                                                    |
|   WESTERN PITFALL:                            INDIAN STRATEGIC MANDATE:                            |
|   Allowing commercial property crime to       Treat supply chain and inventory security as         |
|   be treated as a low-priority misdemeanor.   a mission-critical pillar of national security.      |
|                                                                                                    |
|   RESULT: Empty downtowns, skyrocketing       GOAL: A frictionless logistics network supporting    |
|   insurance, and an flight of productive      a $30-trillion economy with zero tolerance for       |
|   capital to safer jurisdictions.             organized property theft.                            |
+----------------------------------------------------------------------------------------------------+
Physical security is not a luxury that follows economic development; it is the foundation that makes long-term investment possible in the first place.
Strategic Playbook: Protecting Capital Across Fragmented Jurisdictions
Given this persistent property crime divide, institutional allocators, commercial enterprises, and supply-chain directors must run a clear-eyed operational playbook to insulate assets from high-friction jurisdictions:
+----------------------------------------------------------------------------------------------------+
|                             SUPPLY CHAIN SURVIVAL PROTOCOL                                         |
|                                                                                                    |
|  [Tier-1 / High Exposure: NM, CO, WA, LA, CA]                                                      |
|   • Shift inventory management to Just-In-Time (JIT) to minimize overnight warehouse exposure.     |
|   • Mandate edge-computing camera surveillance paired with private remote-response security.       |
|   • Structure corporate entities to self-insure via specialized captive insurance vehicles.        |
|                                                                                                    |
|  [Tier-2 / Defensive Anchors: NC, VA, UT, WI, NE, NH, MA]                                          |
|   • Centralize regional distribution hubs to benefit from lower property insurance rates.          |
|   • Secure long-term industrial leases to lock in lower operating overheads.                       |
|   • Direct capital investment toward automation rather than high security spending.                 |
+----------------------------------------------------------------------------------------------------+
Complete 50-State Strategic Matrix
The table below groups states into operational risk categories based on their 2025 property crime rates per 100,000 residents, providing clear guidelines for capital allocation and corporate footprint planning.
| Jurisdictional Risk Tier | States Included | Property Crime Band (per 100K) | Recommended Corporate Action Plan |
| Tier-1: Critical Exposure | New Mexico, Colorado, Washington, Louisiana, California, Oregon | 2,300 to 2,650 | Audit retail presence; shift high-value assets to secure facilities; factor a 15-20% security risk premium into new investments. |
| Tier-2: Elevated Friction | Alaska, Nevada, Arizona, Texas, New York, Illinois, Florida | 1,750 to 2,250 | Enforce strict perimeter security; run aggressive loss-prevention programs; monitor rising municipal insurance rates. |
| Tier-3: Median Equilibrium | Tennessee, Missouri, Oklahoma, Georgia, Ohio, Michigan, Indiana | 1,400 to 1,700 | Good for balanced regional distribution hubs; prioritize sites with stable municipal public safety funding. |
| Tier-4: Capital Safe Harbors | Alabama, Mississippi, Pennsylvania, South Carolina, North Carolina, Montana, Arkansas, Virginia, Kentucky | 1,000 to 1,350 | Prime targets for manufacturing and warehousing; lower property losses offset slightly higher local infrastructure costs. |
| Tier-5: Fortress Enclaves | North Dakota, West Virginia, South Dakota, Utah, Kansas, Idaho, Hawaii, Vermont, Minnesota, Wyoming, Wisconsin, Iowa, Nebraska, New Hampshire, Maine, Massachusetts | 300 to 950 | Premier operational havens; ideal for high-value research labs, automated data centers, and advanced manufacturing. |
(The Golden Opportunity): Companies that strategically move their logistics and warehousing networks from Tier-1 and Tier-2 risk states into Tier-4 and Tier-5 safe harbors can systematically lower their operating overhead by 120 to 280 basis points, turning superior asset security into a structural competitive edge.
My Verdict: The Long Economic Horizon (2026–2047)
Let us cut through the political rhetoric: Capital goes where it is protected, and leaves where it is plundered.
Between now and 2030, we will see the gap widen between low-friction and high-friction jurisdictions. States like California, Washington, Colorado, and New Mexico will face an escalating economic squeeze. As commercial property values adjust downward to account for retail shrink, urban vacancies, and surging insurance rates, their municipal budgets will face mounting strains.
These governments will likely respond by raising taxes on their remaining corporate and high-earning residents, which will only accelerate the departure of the productive tax base.
Between 2030 and 2047, the broader macro environment will force a reckoning. As AI-driven automation, drone logistics, and near-shoring redefine global supply chains, industrial investment will bypass unstable urban centers entirely. New capital will flow directly into secured, purpose-built manufacturing hubs located in states and countries that guarantee the rule of law.
The economic winners of the mid-21st century will not be the jurisdictions that boast about high gross domestic product while letting local stores be ransacked with impunity. The winners will be the pragmatic economies whether a sensible US state like New Hampshire or an ascending, disciplined industrial India that recognize a basic truth: The right to build and protect property is the bedrock of all economic prosperity.
GOOGLE ‘PEOPLE ALSO ASK’ FAQs
Q1: Which US state has the highest property crime rate in 2025?
A: 2,650 property crimes per 100,000 residents place New Mexico at the highest exposure tier nationwide. This figure exceeds the national baseline by 60.6%, imposing severe commercial friction and inventory surcharges on operating businesses.
Q2: Which US states have the lowest property crime rates?
A: 300 offenses per 100,000 people make Massachusetts and Maine the lowest property crime jurisdictions in the nation. New Hampshire follows closely at 350, providing institutional safe harbors with minimal physical asset risk.
Q3: How does commercial property crime affect business operating costs?
A: 8% to 12% of gross operating margins are routinely lost to commercial theft, private security contracts, and inventory shrink in high-crime states. A 3% margin retailer requires $33.33 in new sales to offset every dollar stolen.
Q4: How does US property crime compare to international Tier-1 benchmarks?
A: 310 incidents per 100,000 residents in Tokyo, Japan establish an international benchmark far below top US states like California (2,350) and Washington (2,450). High-exposure US states mirror emerging frontier risk levels rather than developed-market peers.
Q5: Why are logistics and industrial hubs migrating to lower-crime states?
A: 120 to 280 basis points in overhead savings drive multi-state enterprises toward lower-risk jurisdictions like North Carolina and Indiana. Lower crime significantly cuts commercial insurance deductibles and limits supply chain disruptions ahead of 2030.
Data Source:
- Federal Bureau of Investigation (FBI)
- Uniform Crime Reporting (UCR)
- Bureau of Justice Statistics (BJS)
- National Incident-Based Reporting System (NIBRS).
Disclaimer: This report is for informational and analytical purposes only and does not constitute formal financial, investment, or policy advice.