The Real Estate of Heartbreak: How America’s Fracture Lines Reveal Global Economic Fragility
| State | Divorce Rate (per 1,000 married women, 2025 est.) |
|---|---|
| Arkansas |
11.9% |
| Wyoming |
11.0% |
| North Dakota |
10.7% |
| South Dakota |
10.6% |
| Idaho |
10.3% |
| W. Virginia |
10.2% |
| Arizona |
10.1% |
| Montana |
10.4% |
| Mississippi |
10.5% |
| New Mexico |
10.0% |
| Kentucky |
9.9% |
| Alaska |
9.9% |
| Alabama |
9.8% |
| Oklahoma |
9.7% |
| Tennessee |
9.6% |
| Missouri |
9.5% |
| S. Carolina |
9.4% |
| Nebraska |
9.3% |
| Kansas |
9.2% |
| Iowa |
9.1% |
| Nevada |
9.0% |
| Indiana |
8.9% |
| Utah |
8.8% |
| N. Carolina |
8.7% |
| Ohio |
8.5% |
| Georgia |
8.6% |
| Hawaii |
8.4% |
| Colorado |
8.3% |
| Delaware |
8.1% |
| Oregon |
8.2% |
| Florida |
8.0% |
| Rhode Island |
7.8% |
| Maine |
7.7% |
| Virginia |
7.6% |
| Michigan |
7.5% |
| Minnesota |
7.4% |
| Wisconsin |
7.3% |
| Vermont |
7.2% |
| Pennsylvania |
7.1% |
| Washington |
7.9% |
| Texas |
7.0% |
| New York |
6.6% |
| Maryland |
6.4% |
| N.H. |
6.2% |
| Mass. |
5.4% |
| Louisiana |
5.5% |
| Illinois |
5.5% |
| Conn. |
4.5% |
| New Jersey |
2.6% |
| National Average |
7.1% |
NEW DELHI, India (October 22, 2026 / IST) — Look past the balance sheets of Wall Street, forget the daily noise of central bank interest rate announcements, and turn your eyes toward the kitchen table where families calculate whether they can afford to fall out of love. The single most brutal economic stress test in the modern world is not inflation or sovereign debt. It is divorce.
When a marriage tears apart, the economic blast radius obliterates economies of scale overnight. One mortgage converts into two leases. One power bill duplicates into two utility accounts. Childcare overhead doubles, personal wealth is chopped in half, and legal friction burns billions of dollars of liquid capital into non-productive fees.
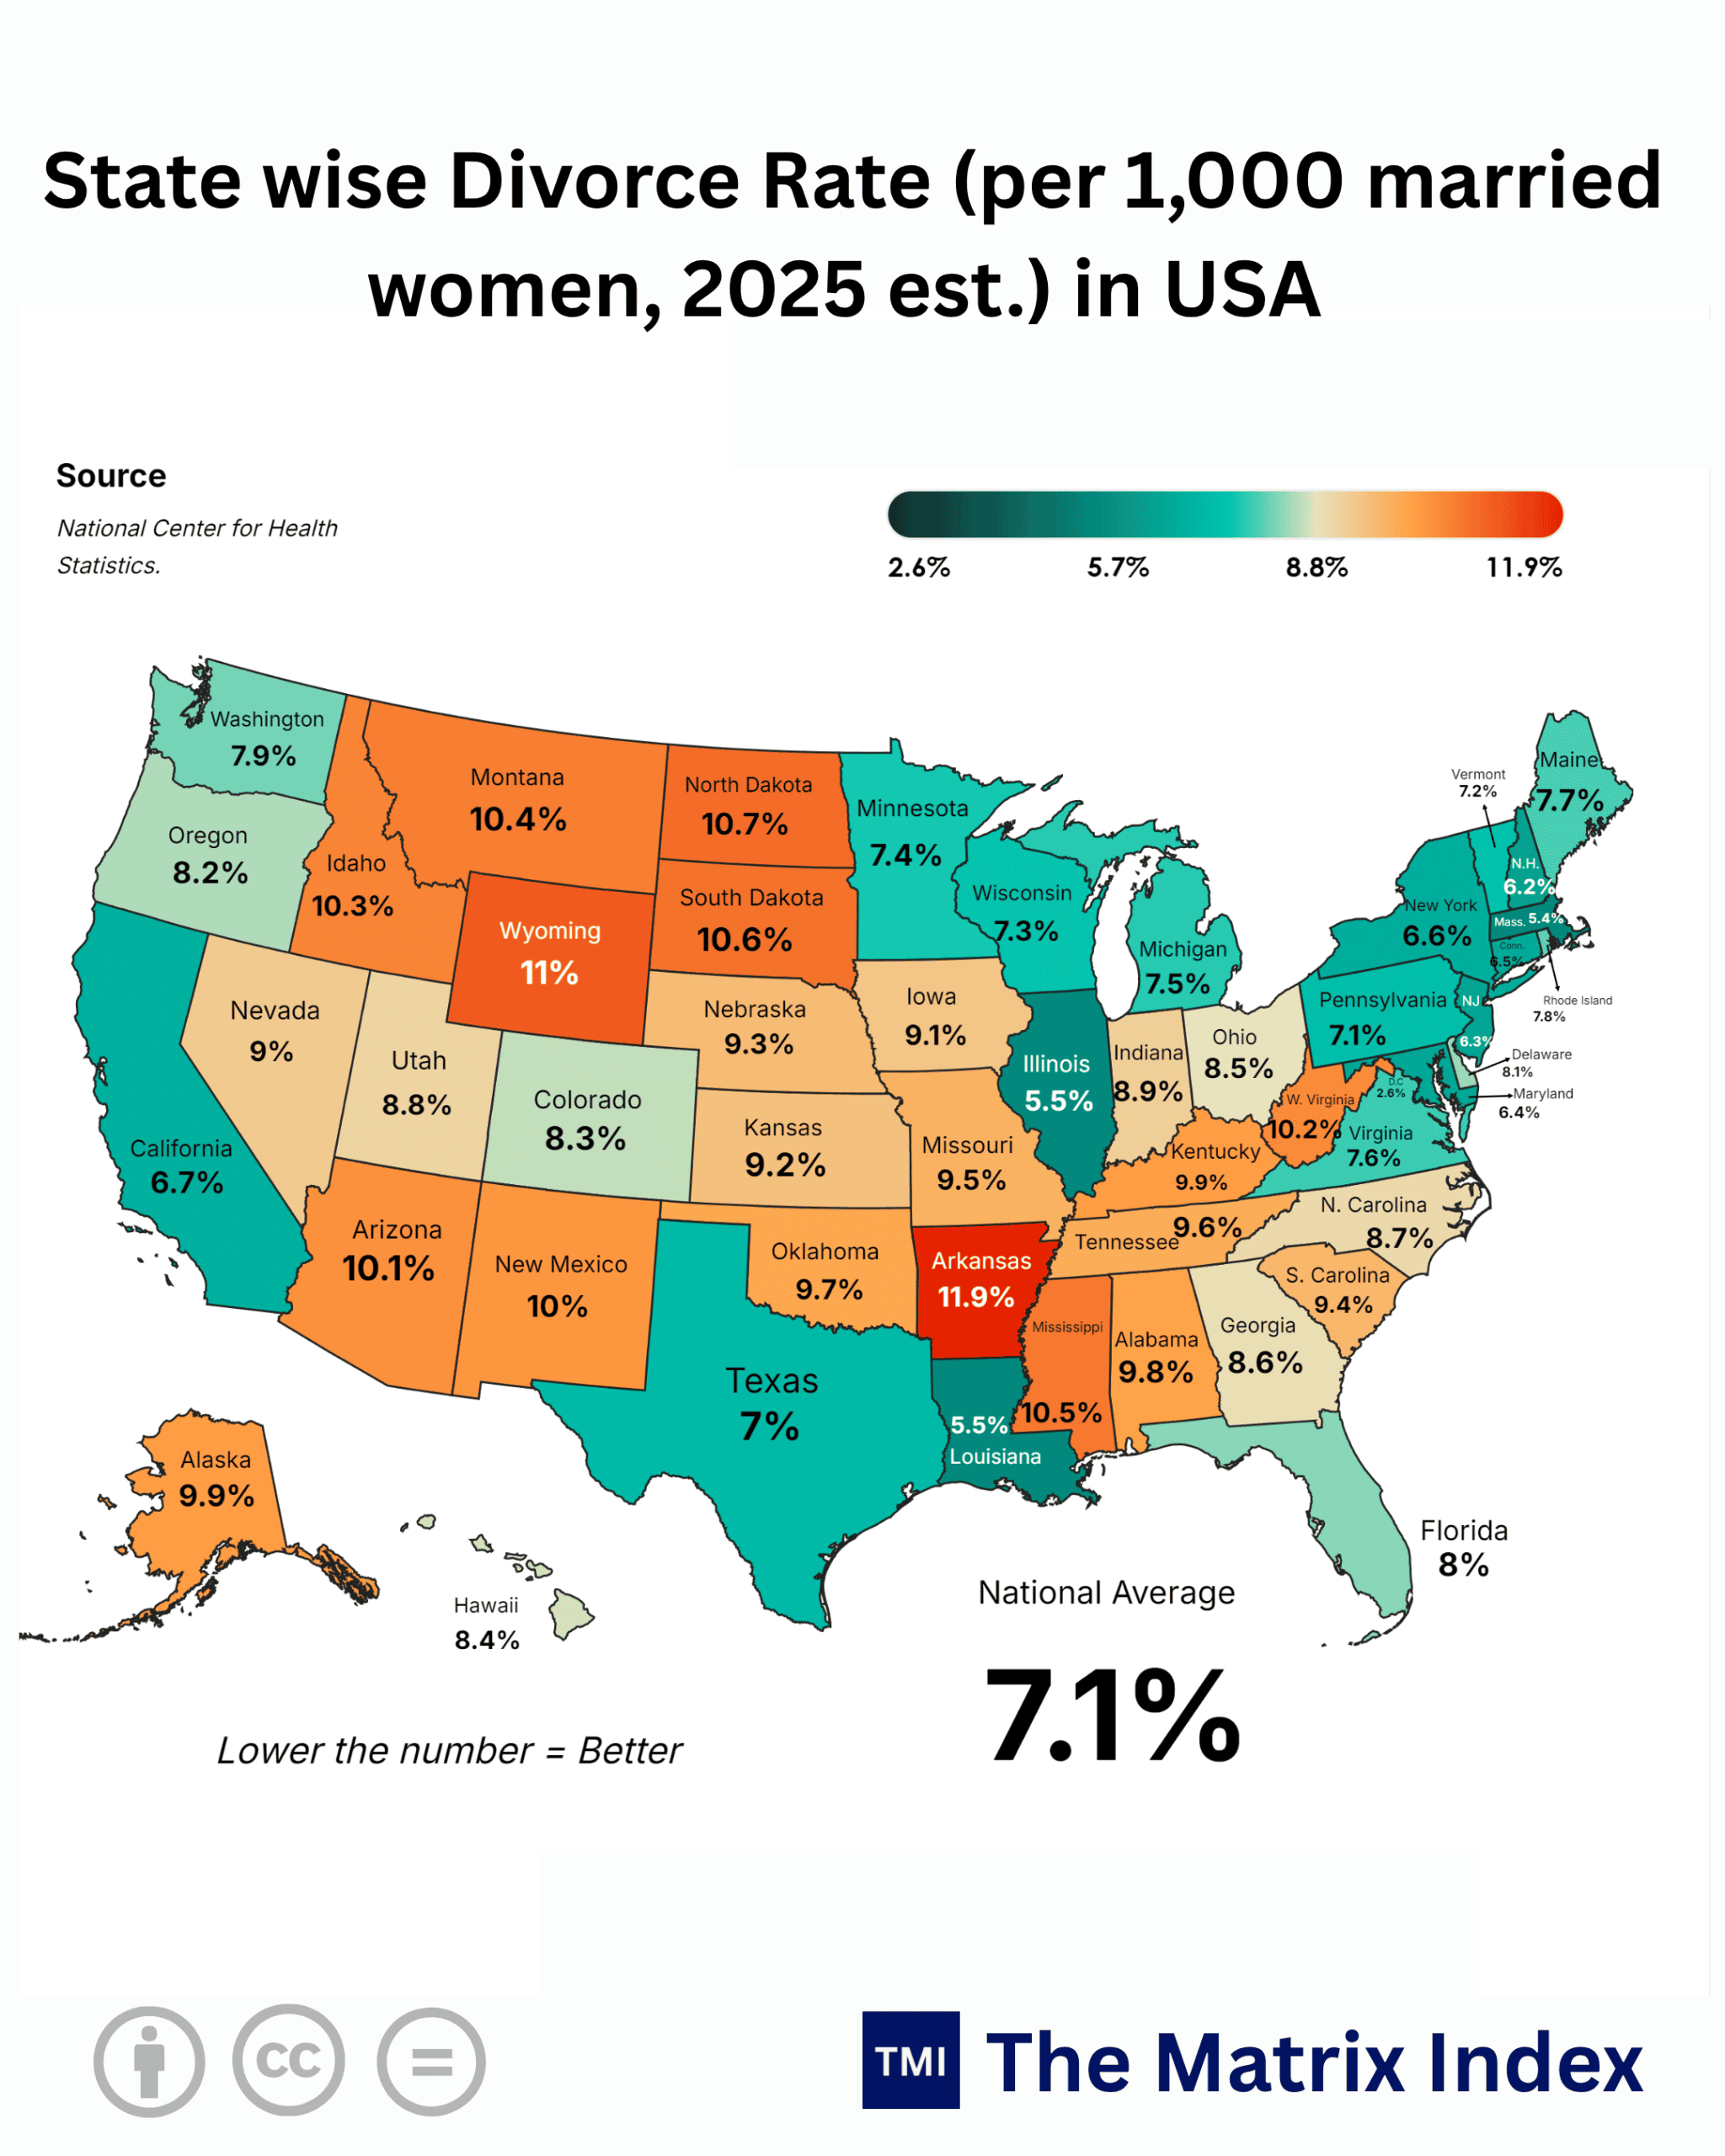
The latest state-level divorce metrics from the United States unveil a profound structural fracture. America’s national divorce rate sits at 7.1 per 1,000 married women, yet the distance between states at the top and bottom of this distribution is staggering.
In Arkansas, the divorce rate explodes to 11.9% (11.9 per 1,000 married women). In Wyoming, it hits 11.0%. In North Dakota and South Dakota, it reaches 10.7% and 10.6%, with Idaho close behind at 10.3%.
Meanwhile, on the East Coast, the numbers tell an entirely different story. New Jersey logs a microscopic 2.6%. Connecticut sits at 4.5%, and Massachusetts records 5.4%.
What makes a marriage in Little Rock, Arkansas more than four times more likely to dissolve than one in Princeton, New Jersey? It is not morality. It is not religion. It is raw, unforgiving, systemic capital economics.
The Great Continental Divide: Mapping the Raw Ledger
The numbers reflect an undeniable structural divide across the American landmass. High divorce rates concentrate in low-wage, high-debt, commodity-dependent, or hyper-transient economies. Low rates cluster inside asset-dense, high-barrier jurisdictions where the fiscal cost of dissolving a household operates as a form of financial hostage-taking.
Consolidated State Divorce Ledger (Per 1,000 Married Women)
(The Bitter Truth): Poor couples do not stay together longer out of moral superiority; they fracture under the weight of unpayable subprime debt, medical shocks, and paycheck-to-paycheck volatility. Conversely, the ultra-wealthy do not preserve their marriages purely out of love. In states like New Jersey (2.6%), the combined burden of high property taxes, complex corporate assets, and exorbitant legal retainers turns divorce into financial suicide. The rich stay married to protect their balance sheets; the poor divorce because they have nothing left to salvage.
The “So What?” Factor: Why Societal Breakdowns Drain the Real Economy
The macro consequences of a surging divorce rate extend far beyond family courts. Consider the direct transmission channels through which elevated domestic instability disrupts capital markets, sovereign productivity, and enterprise growth:
[Domestic Dissolution]
        │
        ├──> Wealth Destruction (50% Split, High Legal Frictions)
        │           └──> Collateral Drain & Depressed Capital Expenditure
        │
        ├──> Asset Liquidation Under Duress
        │           └──> Fire-Sale Housing Trends & Distorted Local Valuations
        │
        └──> Disruption of Single-Unit Household Economies
                    └──> Double Infrastructure Spending (Rent, Energy, Autos)
                                └──> Chronic Decline in Consumer Discretionary Savings
The Destruction of Household Collateral
When a couple divorces, their single largest balance sheet asset the primary residence is frequently forced onto the market under duress.
In an elevated interest rate environment, liquidating a home mortgaged at 3% to purchase two smaller properties financed at 6.5% to 7.0% is value destruction. This transaction extracts liquid equity, redirects it toward closing fees, and leaves both individuals with higher monthly carrying costs for inferior square footage.
The collateral pool that fuels small business ventures, angel investments, and secondary educational funding is abruptly wiped clean.
Industrial Productivity Friction
Divorce represents an unhedged operational risk for corporations. The psychological, logistical, and legal strain of marital dissolution reduces employee productivity by an estimated 40% over a multi-year window.
In jurisdictions with double-digit divorce numbers like Arkansas (11.9%) and Wyoming (11.0%), corporate turnover accelerates, disability filings tick upward, and regional human capital degrades. A transient workforce cannot build compound knowledge.
The Inflationary Micro-Shock of Dual Households
Two people living together enjoy shared utilities, consolidated food preparation, and singular heating and cooling overhead. The moment they split, their resource footprint bifurcates.
They require two washers, two dryers, two high-speed internet connections, and two separate vehicle leases. This dynamic creates an artificial, low-productivity spike in consumer demand that drives debt higher rather than creating sustainable economic value.
Global Benchmarks: The Wealth Preservation Game Across Borders
The dynamic playing out across the United States reflects global patterns. Wealthy, highly educated enclaves stay married longer or structure their unions under ironclad legal protections, while working-class populations face escalating domestic instability.
Tier-1 Benchmarks: The Industrial Elite
Divorce Rates: Global Industrial Comparison (Selected Economies)
────────────────────────────────────────────────────────────────
Arkansas (US Extreme)   [██████████████████████████████████] 11.9%
United States (Avg)     [███████████████████]                7.1%
United Kingdom          [████████████████]                   6.2%
Germany                 [███████████████]                    5.8%
Australia               [██████████████]                     5.5%
Japan                   [██████████]                         4.1%
New Jersey (US Wealth)  [███████]                            2.6%
India (Formal Urban)    [███]                                1.1%
────────────────────────────────────────────────────────────────
The United States vs. Japan
Japan maintains a national divorce rate near 4.1 per 1,000 married individuals. Its demographic collapse is driven by a refusal to marry in the first place (konkatsu fatigue).
Yet, once married, Japanese households demonstrate elevated cohesion, underpinned by a culture of financial risk aversion and multi-generational real estate commitments.
In contrast, the US national baseline of 7.1% reflects an economy structured on rapid consumption, dynamic labor mobility, and a lack of social safety nets, which pushes financial pressure directly onto the couple.
The United Kingdom and Germany
Across both the UK (6.2%) and Germany (5.8%), divorce rates declined over the past decade. This shift was not driven by marital renewal, but by financial deferral.
Millennials and Generation Z in London, Frankfurt, and Munich are delaying marriage until their mid-30s, after they have established independent careers. In the US Sunbelt and Deep South, early marriages remain common, directly feeding early divorces.
Australia
With a rate stabilizing around 5.5%, Australia’s superannuation framework automatically pools pension assets during marital disputes.
This transparency reduces prolonged litigation, but the country’s severe urban housing shortages in Sydney and Melbourne have forced estranged couples to remain co-inhabitants under one roof. These “functional separations” mirror the structural dynamics seen in New York (6.6%) and Massachusetts (5.4%).
Tier-2 Benchmarks: Emerging Market Friction
China
Following Beijing’s implementation of a mandatory 30-day “cooling-off” period for divorce filings in 2021, Chinese divorce rates dipped, but underlying marital sentiment soured.
Much like South Dakota (10.6%) or Idaho (10.3%), where rapid living-cost inflation has outpaced local wage growth, China’s lower-tier cities have seen soaring domestic disputes tied to unpaid property mortgages and declining real estate values.
Mexico and Brazil
In Latin American economies, legal divorce rates often understate reality due to high levels of informal separation.
Formal divorces occur predominantly among the urban upper-middle class, where complex financial divisions mirror California and Texas (7.0%). Lower-income families separate without formal court intervention, leaving women and children exposed to sudden financial abandonment.
Anatomy of the Data: Mining the Root Causes of State-Level Divergence
The structural drivers behind the disparity between high-divorce states like Arkansas (11.9%) and low-divorce states like New Jersey (2.6%) can be categorized into four primary economic forces.
                   THE FOUR CATALYSTS OF SYSTEMIC BREAKDOWN
┌───────────────────────────────┐     ┌───────────────────────────────┐
│     The Marriage Age Tax      │     │  Extractive Volatility Shock  │
│  Early union entry without an │     │ Boom-and-bust payroll cycles  │
│  established capital buffer.  │     │ in mining, oil, and logging.  │
└──────────────┬────────────────┘     └──────────────┬────────────────┘
               │                                     │
               ▼                                     ▼
      ┌─────────────────────────────────────────────────────┐
      │          DOMESTIC STRESS: BREAKDOWN POINT           │
      └─────────────────────────────────────────────────────┘
               ▲                                     ▲
               │                                     │
┌──────────────┴────────────────┐     ┌──────────────┴────────────────┐
│   The Golden Handcuff Moat    │     │   Safety Net Infrastructure   │
│  Massive asset entanglements  │     │ High state healthcare, paid   │
│  and punitive legal costs.    │     │ parental leave, and wage beds.│
└───────────────────────────────┘     └───────────────────────────────┘
1. The “Marriage Age Tax” and Capital Readiness
In states across the American South and Intermountain West, the median age at first marriage remains historically low frequently between 22 and 25 years old.
Marrying without a solid capital reserve is an enormous financial risk. Couples enter marriage saddled with automotive debt, variable-rate credit card balances, and entry-level wages.
When inflation surges, these households lack an equity buffer. Minor economic shocks a transmission failure, an emergency root canal, a sudden layoff quickly escalate into existential domestic disputes.
In stark contrast, couples in Massachusetts (5.4%), Connecticut (4.5%), and New Jersey (2.6%) routinely delay legal marriage until their early to mid-30s. By that stage, both partners have accumulated liquid capital, developed career stability, and built an equity base that insulates the household from everyday economic shocks.
2. Extractive Commodities vs. Institutional Knowledge Economies
States with elevated divorce rates like Wyoming (11.0%), North Dakota (10.7%), and West Virginia (10.2%) rely heavily on volatile, commodity-based economies: coal, oil, natural gas, and seasonal logging.
These industries subject workers to boom-and-bust cycles. During an energy boom, blue-collar workers command six-figure salaries, leading to commitments on expensive trucks, boats, and large homes.
When commodity prices drop, payrolls vanish overnight. Marriages built on high-stress shift work, prolonged physical separation, and hyper-volatile incomes fracture under the strain of debt defaults.
Conversely, the knowledge corridors of Virginia (7.6%), Maryland (6.4%), and New York (6.6%) are anchored by federal payrolls, corporate headquarters, and institutional healthcare systems. Incomes are steadier, predictability is higher, and the financial foundation remains durable over the economic cycle.
3. The “Golden Handcuff Moat”
In high-cost, high-wealth states, the prohibitive cost of divorce acts as an artificial stabilizer.
Consider New Jersey (2.6%), where the median home value sits near $550,000, property taxes routinely clear $10,000 to $15,000 per year, and specialized matrimonial litigation retainers start at $25,000.
Typical Cost of Contested Matrimonial Dissolution (Asset > $1.5M)
────────────────────────────────────────────────────────────────
Legal Retainers (Both Parties)      : $50,000 – $120,000
Forensic Accounting / Valuation     : $25,000 – $60,000
Real Estate Liquidation Costs (6%)  : $60,000 – $100,000
Refinancing Surcharge (3% to 7% APR): $18,000/year (Ongoing)
────────────────────────────────────────────────────────────────
Total Liquidity Burn at Exit        : Up to $250,000+
When an affluent couple in Bergen County, New Jersey or Fairfield County, Connecticut contemplates separation, their financial advisors lay out a sobering reality: liquidating their assets, surrendering their grandfathered 3% mortgage, paying legal retainers, and splitting retirement accounts will instantly strip both partners of their socioeconomic standing.
They stay legally married not out of harmony, but because they cannot afford the capital haircut. The marriage functions as a closed-end holding company.
4. Divergent Social Safety Nets and Healthcare Burdens
Medical debt remains a primary driver of consumer bankruptcies across the United States.
In non-Medicaid-expansion states across the South, a serious health diagnosis often wipes out a family’s savings within ninety days. Medical bankruptcies frequently precede marital dissolution.
In states like Minnesota (7.4%), Illinois (5.5%), and New York (6.6%), broader state-sponsored health programs, higher rates of corporate benefits, and paid family leave policies help cushion households from unexpected crises.
Seasonality, Anomalies, and the Ghost of the Pandemic
The current divorce figures reflect a structural, multi-decade realignment rather than a temporary statistical spike.
Timeline: Structural Shifts in US Marital Stability (1980–2026)
───────────────────────────────────────────────────────────────────────
[1981] ── Historic Peak (US Divorce Rate: ~22.6 per 1,000)
           No-Fault Divorce statutes sweep across all jurisdictions.
              │
[2008] ── The Great Financial Crisis Freeze
           Divorce filings plunge artificially as home equity evaporates.
              │
[2020] ── Pandemic Court Closures & Legal Backlogs
           Filings collapse administratively; domestic strain compounds.
              │
[2022] ── The Inflationary Hangover & Legal Backlog Wave
           Courts clear the pipeline; high interest rates stress low earners.
              │
[2026] ── The Present Structural Bifurcation
           The National Average falls to 7.1%, but working-class states stay above 10%.
The Court Backlog Unwind
Between 2020 and 2022, legal system disruptions artificially suppressed divorce filings across urban centers.
Couples could not process paperwork, secure trial dates, or sell property. The subsequent data from 2023 through 2025 saw an influx of cleared cases, momentarily inflating divorce tallies in jurisdictions like Arizona (10.1%) and Idaho (10.3%).
Today, that procedural backlog has largely worked through the courts. The numbers we see now are real, persistent baseline figures.
The Rise of Non-Marriage
The falling aggregate US national divorce rate down from historical highs of over 22 per 1,000 married women in 1980 to 7.1% today does not mean modern marriages are three times happier.
It reveals that fewer people are getting married in the first place.
Marriage is increasingly turning into a luxury good reserved for the college-educated, high-income elite. Lower-earning populations are abandoning the legal institution entirely, substituting it with informal cohabitation that falls outside official divorce registries.
The decline in the national average conceals the crisis unfolding in blue-collar communities.
The Two-Sided Ledger: Structural Scenarios Ahead
Analyzing the economic forces behind the divorce divide reveals two distinct trajectories for markets, corporate lenders, and real estate developers looking toward 2030.
The Bull Case: The “Consolidated Capital” Paradigm
            THE BULL CASE: RESILIENT BALANCE SHEETS

   Rising Dual-Income          Shared Equity Moats       High-Barrier Family
       Knowledge                   Insulate from               Pacts Anchor
     Professionals             Refinancing Traps         Long-Term Capital
   ┌───────────────┐           ┌───────────────┐         ┌───────────────┐
   │ High Earning  │           │ Low-Rate      │         │ Real Wealth   │
   │ Concentration │──────────>│ Mortgages     │────────>│ Accumulation  │
   │ in Tech/Fin   │           │ Kept Intact   │         │ Across Decades│
   └───────────────┘           └───────────────┘         └───────────────┘
-
Dual-Income Knowledge Fortresses: In Tier-1 states, marriages function as diversified asset-holding entities. Two white-collar salaries, paired with inherited family equity, provide a strong defense against inflation.
-
The Power of the 3% Mortgage: Millions of couples hold 30-year fixed mortgages at 2.5% to 3.5%. This interest rate structure creates an enormous economic incentive to resolve disputes and preserve the household, shielding regional real estate from forced liquidations.
-
Corporate and Human Capital Stability: Low divorce environments in the Northeast, Upper Midwest, and Mid-Atlantic preserve domestic stability, supporting predictable executive workforces, dependable retirement funding, and intergenerational asset transfers.
-
The India Analogy: India’s low formal divorce rate (under 1.5% in urban centers) historically served as a private, self-funded social safety net, taking the place of state-sponsored welfare. When family units remain solvent, capital pools naturally compound over decades.
The Bear Case: The “Solitary Consumption” Trap
            THE BEAR CASE: FRAGMENTED CAPITAL DRAIN

   Subprime Domestic             Two Overleveraged          Discretionary CapEx
       Financial                   Single-Income            Collapse Across
       Pressures                    Households               Local Economies
   ┌───────────────┐           ┌───────────────┐         ┌───────────────┐
   │ High Unsecured│           │ Duplicate     │         │ Vanishing     │
   │ Credit Lines  │──────────>│ Fixed Rent    │────────>│ Emergency     │
   │ Burn Reserves │           │ and Utilities │         │ Safety Nets   │
   └───────────────┘           └───────────────┘         └───────────────┘
-
Subprime Domestic Default Contagion: In high-divorce states like Arkansas (11.9%) and Mississippi (10.5%), marital breakdowns push both partners onto state-assisted healthcare, Supplemental Nutrition Assistance Programs (SNAP), and personal bankruptcy rosters.
-
Forced Liquidation Shocks: The breakdown of agricultural, logistics, and blue-collar households in the Midwest and Sunbelt forces local properties onto the market, soft-pedaling real estate values in tertiary and exurban regions.
-
The Single-Parent Wage Trap: The sudden transition from a dual-earner or dual-carer unit into a single-parent household lowers earning potential, slashes discretionary spending, and pushes personal balance sheets into revolving credit card debt at 24% to 28% APR.
-
Institutional Drag: State governments must absorb the downstream costs: managing overburdened family courts, expanding social safety net programs, and supporting schools serving children destabilized by domestic disruption.
The Alternative Scenario: What if Policy or Markets Pivot?
What happens if the underlying legal or financial framework changes dramatically over the next three to five years? Consider the following counter-narrative:
The Covenant Marriage & Legal Reform Movement
Conservative legislatures in states like Arkansas, Idaho, and Oklahoma are already discussing proposals to reform or scale back unilateral no-fault divorce laws.
If red states mandate extended mediation, mutual consent, or fault-based requirements, official divorce rates in those jurisdictions could plunge artificially over a twenty-four-month period.
However, suppressing formal divorce would not cure the underlying economic strain; it would simply shift legal dissolution into informal abandonment, family distress, and parallel underground debt defaults.
       COUNTER-NARRATIVE: REAL ESTATE DISRUPTIONS

┌───────────────────────────────────┐     ┌───────────────────────────────────┐
│       POLICY / MARKET SHOCK       │     │         DIRECT CONSEQUENCE        │
│                                   │     │                                   │
│  Mortgage Rates Drop to ~4.5%     │────>│  Trapped Spouses Finally Liquidate│
│  The "Golden Handcuff" Dissolves  │     │  Hidden Divorces Surge in NE/West │
└───────────────────────────────────┘     └───────────────────────────────────┘
The Mortgage Rate Thaw
If global central banks bring sovereign benchmark rates down and average US mortgage rates decline toward 4.5%, the golden handcuffs keeping affluent couples together in New Jersey (2.6%), Connecticut (4.5%), and New York (6.6%) could begin to unlock.
A wave of delayed divorces would release hundreds of billions of dollars in upscale residential inventory onto the market, providing liquidity for family law practices, secondary home relocations, and dual-rental developments.
High-Divorce vs. Low-Divorce States: A Structural Comparison
High-Divorce States vs. Low-Divorce States
(The Golden Opportunity): Institutional investors, private credit desks, and alternative multi-family real estate funds have a clear opening. Regions with high divorce rates require purpose-built single-parent housing, flexible mid-tier rentals, credit repair facilities, and micro-childcare logistics. In contrast, capital-fortified, low-divorce states remain prime ground for multi-generational wealth management, estate planning structures, and luxury single-family asset financing.
The India Benchmark: What This Means for Vision 2030 and Viksit Bharat 2047
Looking at the American data from New Delhi highlights an inescapable economic reality: a nation’s family structure is a foundational piece of its macroeconomic infrastructure.
INDIA'S CRUCIAL ECONOMIC BRIDGE (2026–2047)
─────────────────────────────────────────────────────────────────────────────
Traditional Family Balance Sheet             The Emerging Urban Pressure Cooker
[Universal Joint Household Security]   ───>   [Skyrocketing Metro Rents & Debt]
[Informal Childcare & Elder Care]             [Dual-Career Time Deficits]
[Low Baseline Consumption Multipliers]        [High-Stress Nuclear Household Units]
─────────────────────────────────────────────────────────────────────────────
             │
             └──> THE POLICY CHOICE:
                  Absorb the Western Solitary Trap OR Build Purpose-Built
                  Welfare, Housing, and Dual-Earner Infrastructure.
As India charges toward Vision 2030 and its goal of becoming an advanced economy by Viksit Bharat 2047, it is undergoing the largest urban migration and real estate transition in human history.
For generations, India’s national divorce rate hovered below 1.5%. This stability was often achieved at significant personal and social cost, particularly for women who lacked financial independence.
However, looking at it strictly through an economic lens, the traditional family structure served as India’s primary welfare mechanism. It provided informal elder care, consolidated real estate costs across generations, pooled risk during agricultural or industrial downturns, and lowered the demand for state-funded support.
That foundation is now shifting in major Indian metros.
In Bengaluru, Mumbai, Gurugram, and Hyderabad, young professionals face dynamics that closely mirror the American Sunbelt: soaring urban rents, nuclear household isolation, surging consumer credit usage, and intense dual-career stress.
Divorce filings across urban family courts have increased over the past decade. When an urban Indian household splits, the economic fallout is swift. In cities where two-bedroom apartments demand significant portions of take-home pay, moving from a joint or shared home into two independent apartments wipes out savings overnight.
If India is to sustain high gross domestic savings and convert household capital into long-term infrastructure investment, policymakers must recognize what the data from Arkansas (11.9%) versus New Jersey (2.6%) makes clear:
            THE MACROECONOMIC SOVEREIGN CYCLE

     Poverty / Under-Capitalization
     Leads to Premature Unions
            │
            ▼
     Sudden Household Fractures
            │
            ▼
     Subprime Credit Dependency &
     Depressed Capital Accumulation
            │
            ▼
     Sovereign State Welfare Burden &
     Declining Structural Productivity
If young citizens are pushed into modern urban markets without adequate real estate stock, affordable childcare systems, and financial literacy, domestic strain will rise.
Divorce is not an isolated lifestyle metric. It is an economic indicator. A society that fragments its family units without building replacement safety nets ends up with a weakened, overleveraged consumer base.
Strategic Blueprint: The 2026–2030–2047 Outlook
The state-level data in this ledger maps a clear path forward. Looking out over the next three decades, these dynamics will shape personal finance, corporate risk, and macroeconomic policy.
THE MULTI-DECADE STRUCTURAL ROADMAP
───────────────────────────────────────────────────────────────────
Phase 1: 2026–2030 ── The Liquidity Realignment
         • Peak of the 3% US Mortgage Lock-In effect.
         • Emergence of legal and financial separation arbitrage.
         • Urban India experiences accelerated domestic friction.

Phase 2: 2030–2040 ── The Demutualization of the Household
         • Single-person households become the dominant demographic
           engine of urban rental demand across OECD nations.
         • Rise of personalized private credit facilities designed
           to bail out fragmented family units.

Phase 3: 2040–2047 ── The Institutional Wealth Settlement
         • Knowledge economies bifurcate entirely into multi-generational
           dynastic capital fortresses versus transient rental classes.
         • Sovereign states forced to establish formal economic backstops
           to replace the lost productivity of dissolved domestic units.
───────────────────────────────────────────────────────────────────
The Executive Verdict
1. The Myth of Cultural Superiority Must Die: States do not register high divorce rates because their citizens care less about family values; they register high rates because they carry volatile debt, enter adulthood with inadequate capital buffers, and work in unpredictable industries. Arkansas (11.9%) and Mississippi (10.5%) are sounding an economic alarm.
2. Wealth Creates Its Own Marital Armor: The near-negligible rates in New Jersey (2.6%) and Connecticut (4.5%) show that when spouses hold significant shared assets, high exit costs encourage dispute resolution. Marriage in the knowledge economy has evolved into a strategic partnership designed for wealth preservation.
3. Investors Must Price the Cost of Domestic Risk: Underwriters, venture capital desks, and regional credit providers should incorporate regional household stability metrics into their broader underwriting models. Where divorce runs in the double digits, consumer debt defaults follow, small business longevity declines, and workforce turnover remains elevated.
Action Plan for Investors, Enterprises, and Policy Architects
-
Enterprise Workforce Infrastructure: Corporate operators operating in Tier-2 and Sunbelt hubs must deploy aggressive employee financial wellness programs, proactive legal insurance, and mental health counseling. Protecting domestic stability is a direct investment in human capital retention.
-
Real Estate Reallocation: Real estate capital should pivot toward flexible multi-family construction, single-parent co-living models, and mid-tier rental portfolios across high-divorce corridors like Idaho, Wyoming, and Arizona. The demographic demand for secondary housing units in these areas is structural and self-renewing.
-
The Indian Sovereign Imperative: Indian urban planners must integrate affordable, high-density family housing and subsidized childcare networks directly into industrial master plans. Preserving the economic viability of young households is essential for the nation to reach its Viksit Bharat 2047 goals without sacrificing consumer balance sheets along the way.
The health of a nation’s economy is written not in its central bank communiqués, but across its household balance sheets. The data from America’s state divorce registries tells a cautionary tale: when the arithmetic of a home fails, the broader economy eventually pays the bill.
GOOGLE ‘PEOPLE ALSO ASK’ FAQs
Q1: Which US state has the highest divorce rate and why?
A: Arkansas leads all states with an 11.9% rate (11.9 per 1,000 married women). Early marriage ages, volatile blue-collar wages, and low household equity reserves leave couples vulnerable to sudden inflationary pressure.
Q2: Why does New Jersey maintain the lowest divorce rate in the United States?
A: New Jersey registers a nation-low 2.6% divorce rate primarily due to punitive exit costs. Extreme property taxes, high home equity, and six-figure legal retainers force affluent couples to preserve their shared marital balance sheets.
Q3: How does divorce destroy individual household wealth economically?
A: Liquidation under duress destroys up to 50% of net assets while doubling fixed living costs like rent and utilities. Spouses forfeit low grandfathered mortgage rates, burning cash reserves on higher replacement financing.
Q4: How does the US national divorce rate compare globally?
A: The US national baseline of 7.1% substantially exceeds industrial peers like Japan at 4.1% and urban India at 1.1%. America’s dynamic labor mobility and privatized safety nets shift structural economic stress directly onto households.
Q5: What is the economic forecast for domestic stability by 2030 and 2047?
A: By 2030, single-person units will dominate rental demand across developed markets as household demutualization accelerates. By 2047, sovereign economies lacking built-in family support must fund massive public welfare backstops.
Data Source:
- U.S. Census Bureau (American Community Survey – ACS)
- National Center for Health Statistics (NCHS)
- National Center for Family
- Marriage Research (NCFMR).
Disclaimer: This report is for informational and analytical purposes only and does not constitute formal financial, investment, or policy advice.