National Average: 1.8%
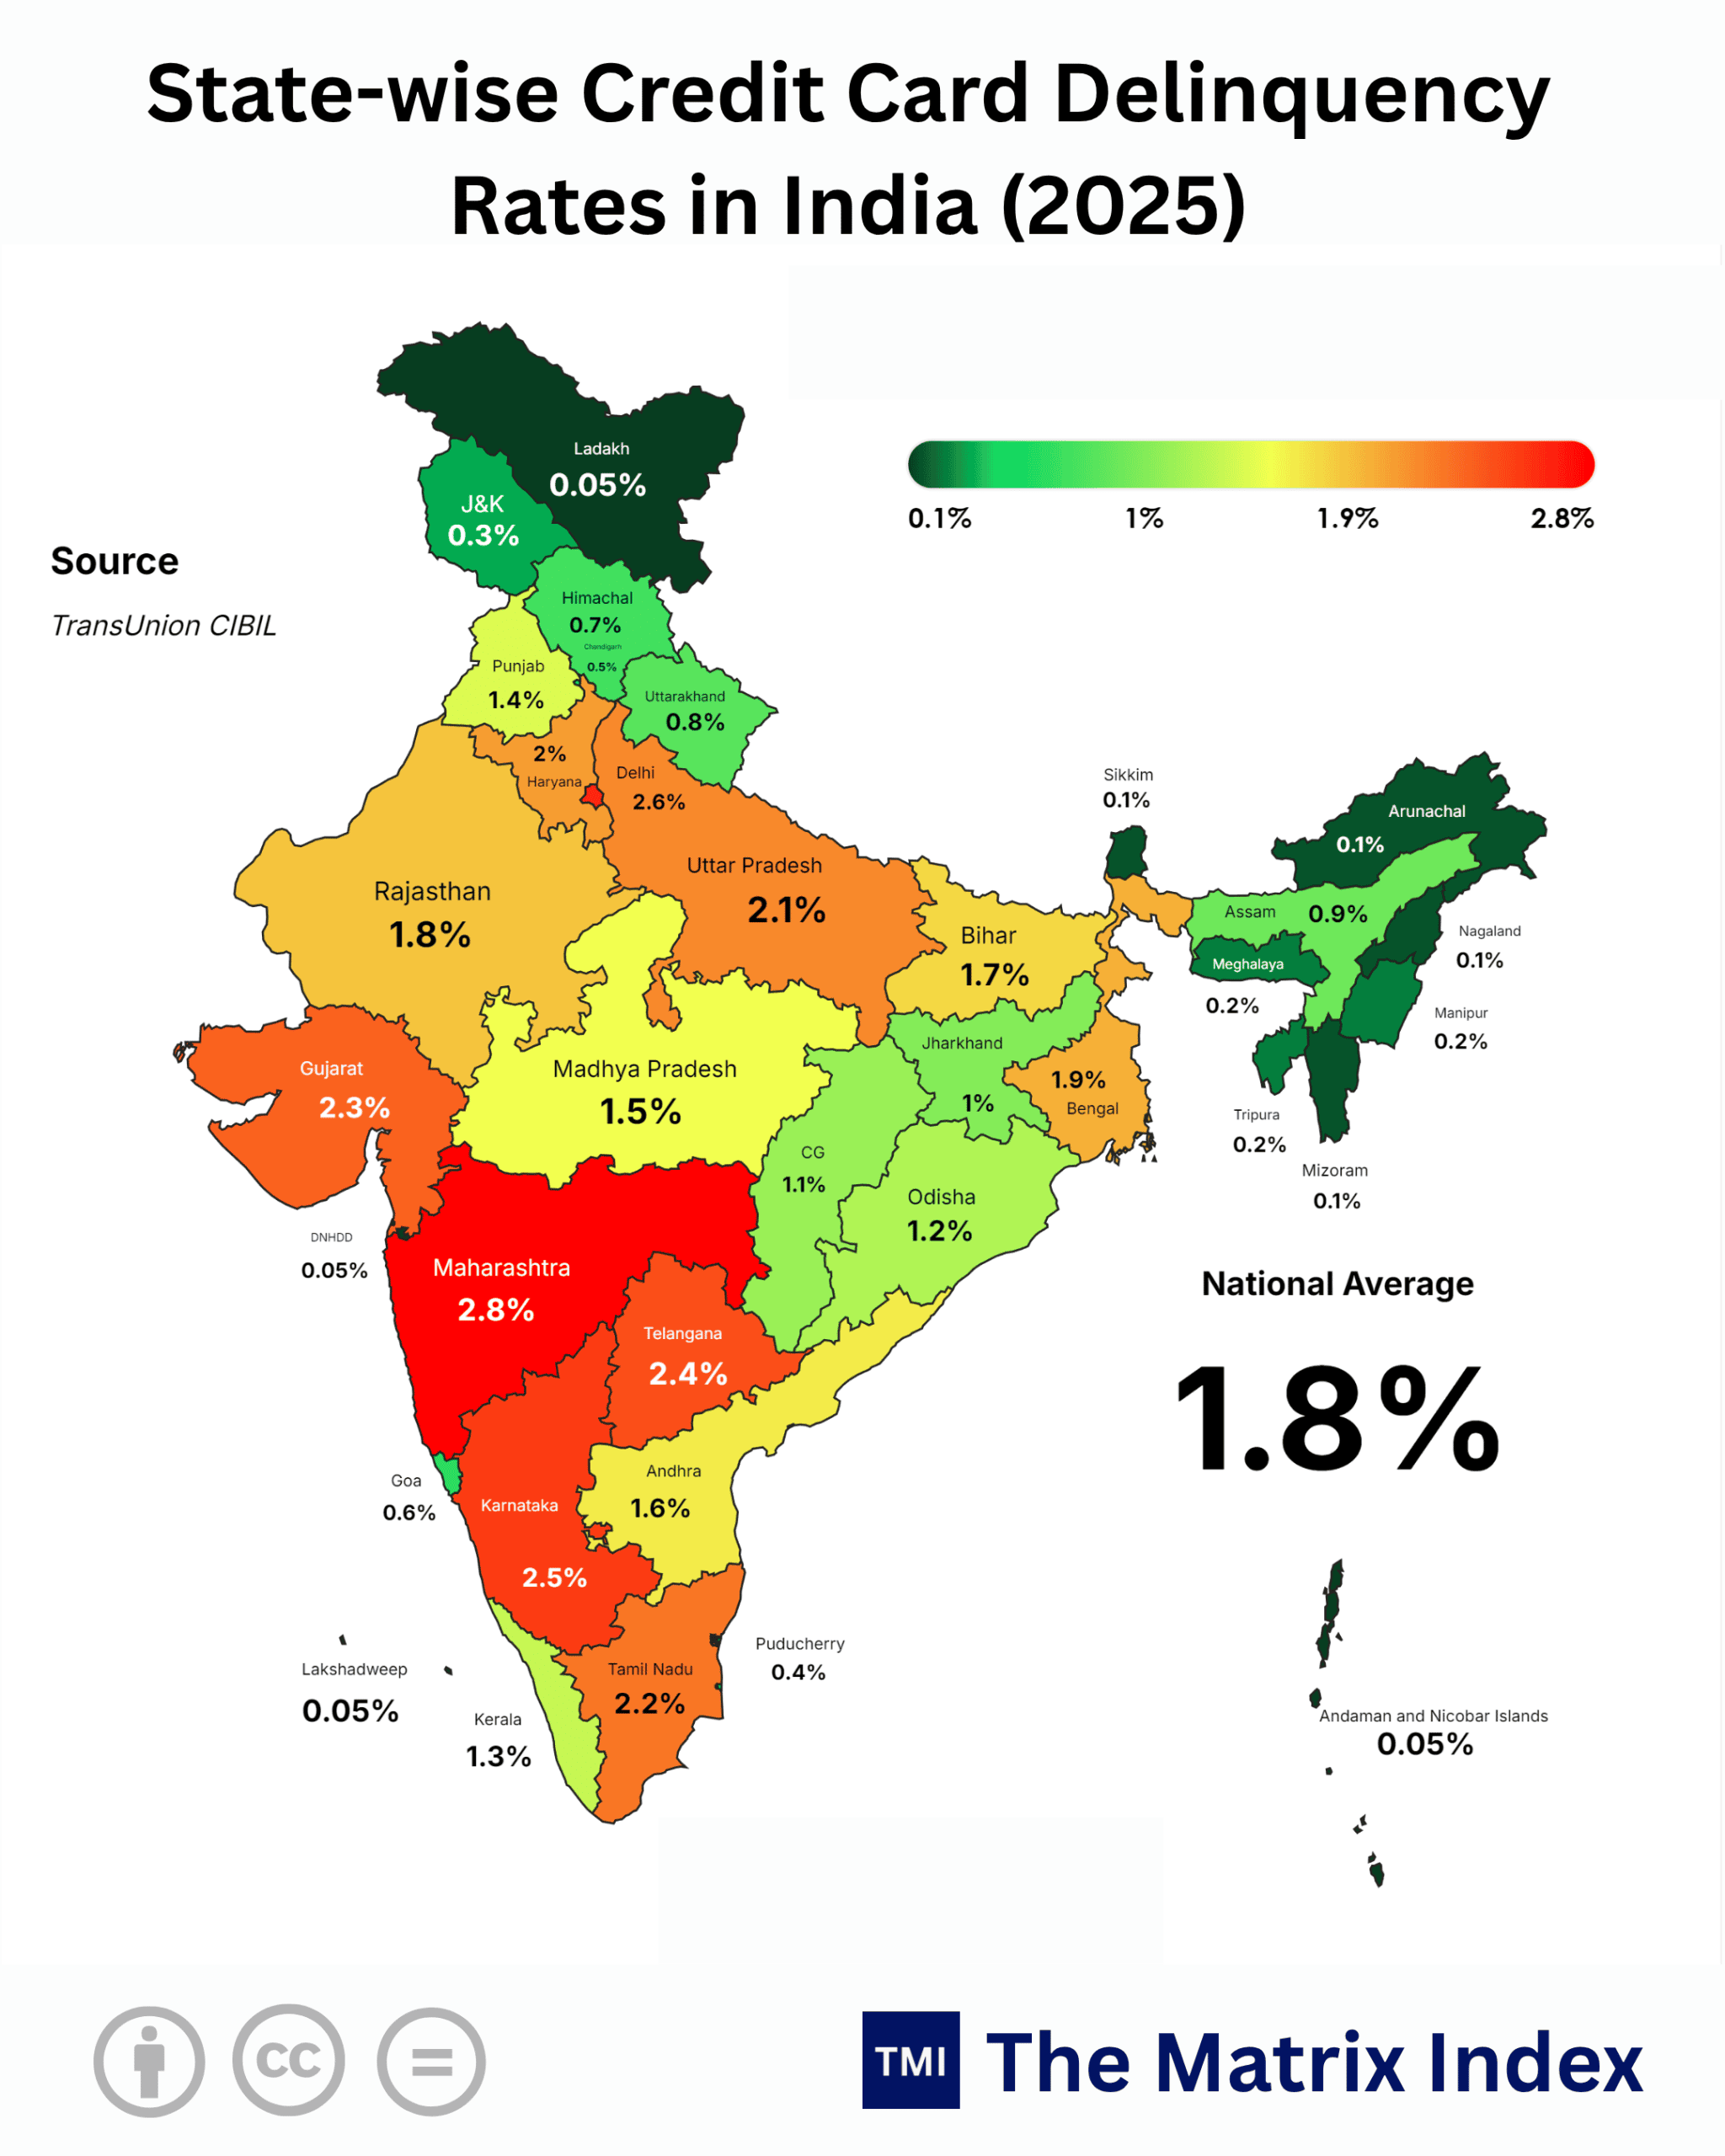
NEW DELHI, India — The illusion of effortless prosperity across India’s industrial corridors has hit a wall of cold, unforgiving arithmetic. Beneath the glossy corporate presentations and soaring market indices, the financial bedrock of the nation’s wealthiest consumption centers is developing hairline fractures that are widening by the week. While the National Average Delinquency Rate appears manageable at 1.8%, a regional post-mortem reveals that the engines driving corporate tax collections, real estate speculation, and consumer credit Maharashtra (2.8%), Delhi (2.6%), Karnataka (2.5%), and Telangana (2.4%) are running on borrowed time and unpaid balances.
For the past five years, monetary authorities and commercial boardroom executives celebrated retail lending growth as evidence of structural formalization. They mistook an aggressive, app-driven credit binge for organic wealth generation. Now, the bill has arrived, and the wealthy states are leading the default curve.
Anatomy of the Rot: When the Growth Engines Falter
Look closely at the numbers before reading another optimistic forecast. Maharashtra, the financial spine of the Republic, does not merely exceed the national average; its delinquency rate of 2.8% sits a staggering 55.5% higher than the baseline. In Delhi, default pressure touches 2.6%, while Bangalore’s technology corridors in Karnataka stand stranded at 2.5%. Telangana, celebrated as the silicon capital of the Deccan, follows at 2.4%.
Why are the richest pockets breaking first? Because credit saturation has outpaced disposable wage growth. The white-collar consumer in Mumbai, Gurugram, and Bengaluru did not buy homes, luxury crossover vehicles, and international holidays using cash flows; they financed them using unsecured personal credit, credit card rolls, and non-collateralized retail loans.
The old Hindi adage captures this delusion perfectly: (Stretch your legs only as far as your blanket extends). India’s metropolitan elite stretched their legs well beyond the blanket, and the winter chill of debt servicing has set in.
The Mechanism of Modern Debt Traps
Let us deconstruct how a borrower in suburban Pune or Bengaluru’s Whitefield ends up in default:
-
Initial Layer (Collateralized): A primary home loan at a floating rate absorbing 45% to 55% of net household take-home income.
-
Second Layer (Auto & Consumer Durable): Fixed-term installments for secondary assets, consuming another 15% to 20%.
-
Third Layer (The Unsecured Buffer): Credit cards and point-of-sale Buy-Now-Pay-Later (BNPL) schemes used for discretionary lifestyle expenditures, grocery aggregators, and school fees.
-
The Tipping Point: A corporate wage freeze, tech retrenchment, or sudden inflationary shock. The third layer collapses instantly, sparking a cascade of cross-default notices across institutional balance sheets.
The Great Indian Delinquency Ledger
The table below breaks down regional credit stress, contrasting the top-tier economic engines against the middle tier and the ultra-low delinquency peripheries.
The Bitter Truth: The states celebrating the highest Gross State Domestic Product (GSDP) numbers are financing their expansion on the backs of distressed consumer balance sheets, while regions dismissed as “economically underdeveloped” demonstrate superior solvency discipline.
Global Parallels: Lessons from Sovereign Debt Explosions
To understand what is unfolding across urban India in 2026, one must step away from domestic headlines and examine global economic history. What we are witnessing is not a localized glitch; it is an exact mirror of the unsecured lending bubbles that hit the developed world over the past four decades.
The United States (2007–2008) Subprime Mirage
In 2006, American financial institutions claimed their risk models were bulletproof. They argued that subprime mortgage delinquency, concentrated in states like Florida, Nevada, and California, was safely ring-fenced. We all know how that ended.
In India today, the financial system does not securitize subprime home loans into synthetic tranches on Wall Street, but it has created an equivalent vulnerability: instant personal digital credit. The rapid surge of fintech lending across Mumbai and Delhi echoes the reckless low-documentation underwriting seen in pre-crisis America.
The Chinese Shadow-Banking Crunch (2020–2022)
When Beijing initiated its “Three Red Lines” policy in August 2020, it exposed a mountain of hidden liabilities held by developers like Evergrande and Country Garden. Chinese households had channeled their life savings into speculative pre-sale real estate.
Look at Telangana (2.4%) and Maharashtra (2.8%). Much of this private leverage is tied to hyper-inflated urban real estate. Land prices in Hyderabad’s Financial District and Mumbai’s suburban belts have risen beyond rental yield realities. The delinquency figures are the early warning tremors of a real estate correction waiting for its trigger.
The German and Japanese Cautionary Tales
In Germany, retail credit expansion is traditionally constrained by cultural aversion to debt (Schulden stems from the word for guilt). The German personal default rate rarely breaches 1.2%, even in economic downturns.
Conversely, Japan’s post-1990 “Lost Decades” demonstrated what happens when balance sheets refuse to consume after an asset bubble bursts. If Indian metropolitan borrowers spend the next decade servicing loans rather than buying goods, India’s domestic consumption engine will grind to a halt.
The “So What?” Factor: Who Pays the Ultimate Toll?
Economic data is useless if it lives only in policy briefs. What does a 2.8% delinquency rate in Maharashtra or 2.5% in Karnataka mean for real people operating in the real economy?
The Middle-Class Professional
If you are an IT employee in Bengaluru or a media executive in Mumbai, the walls are closing in:
-
Borrowing Costs: Banks do not absorb regional defaults out of goodwill; they cross-subsidize losses by widening net interest margins. Prime borrowers with spotless 780+ CIBIL scores are already facing higher loan spreads.
-
The Refinancing Wall: Gone are the days of rolling over debt via easy zero-interest balance transfers. Banks are rejecting refinancing requests at the first sign of debt-to-income stress.
The SME and Manufacturing Ecosystem
In industrial belts like Pune, Surat, and Coimbatore (Tamil Nadu: 2.2%), commercial banks are tightening credit lines:
-
When retail consumers stop paying their bills, institutional lenders tighten underwriting standards across the board.
-
Working capital limits for small vendors are being curtailed, triggering liquidity freezes in supply chains that employ millions of wage workers.
Institutional Investors and Mutual Fund Unit Holders
For those invested in banking and financial sector funds:
-
Credit costs (provisioning) will rise over the next four quarters.
-
The era of record return on assets (RoA) for retail-focused private lenders has peaked. Earnings downgrades are approaching.
Seasonality, Glitches, or Structural Rot?
Bank executives often downplay these figures, labeling them as seasonal anomalies: post-festive inventory drag, year-end agricultural balance settlements, or temporary adjustments following regulatory crackdowns on digital lending apps.
That diagnosis is wrong.
This is not a temporary dip; it is a structural trend. The concentration of default risk in the highest-income states proves that delinquency is tracking leverage depth, not seasonal cash flow interruptions. When Maharashtra (2.8%) and Delhi (2.6%) break away from Kerala (1.3%) or Odisha (1.2%), it indicates that the core credit model in India’s top metros is fundamentally flawed.
Two-Sided Risk Matrix: Bull vs. Bear Case
Every economic situation has two potential paths forward. Here is how India’s credit landscape could evolve between now and 2030.
The Bull Case: Orderly Deleveraging & Tech-Driven Recovery
-
The Premise: The Reserve Bank of India’s aggressive risk-weight hikes on unsecured retail lending succeed in cooling the market without choking enterprise credit.
-
The Trajectory: Metropolitan consumers endure eighteen months of belt-tightening. Household savings rebound from historic lows (5.1% of GDP back toward 8.0%).
-
The Outcome: Delinquency in Maharashtra and Delhi peaks at 3.1% in mid-2027 before settling back down to 2.0%. The corporate sector, with healthy balance sheets, steps in to drive capital expenditure, offsetting weaker consumer spending. India achieves an orderly credit rotation.
The Bear Case: The Contagion Cascade
-
The Premise: Stagnant real wages collide with elevated interest rates, tipping over-leveraged middle-class households into broad-based default.
-
The Trajectory: Personal loan and credit card defaults spill into vehicle financing and home equity lines. Mid-tier non-banking financial companies (NBFCs) dependent on wholesale bank funding face liquidity shortages.
-
The Outcome: Delinquency in Tier-1 states breaches 4.5% by 2028. Banks cut lending to preserve capital, sparking a broader credit crunch that knocks 120 to 150 basis points off India’s annual GDP growth. Urban real estate values experience a sharp correction, trapping a generation of young homeowners in negative equity.
The Alternative Counter-Narrative: What If the Regulators Intervene?
What happens if policymakers decide that rising delinquencies in Maharashtra, Delhi, and Karnataka are politically unacceptable ahead of crucial state elections?
The government could deploy a targeted intervention package:
-
Targeted Restructuring Schemes: Allowing banks to stretch tenure on personal and home loans by up to 60 months without classifying them as Non-Performing Assets (NPAs).
-
Fintech Debt Consolidation Backstops: Facilitating state-supported debt-relief platforms to convert high-interest unsecured debt into low-yield long-term amortizations.
The Hidden Cost: Such measures do not destroy debt; they merely bury it. As Japan discovered during the 1990s, preventing defaults creates “zombie borrowers” households that never go bankrupt, but never spend, invest, or drive growth again. The debt hangs over the economy for decades.
Regional Divergence: The Agrarian and Peripheral Shield
While the industrial engines run hot with debt, examine the opposite end of the spectrum: Bihar (1.7%), Punjab (1.4%), Kerala (1.3%), Odisha (1.2%), and the Northeastern States (0.1% to 0.2%).
Why are default rates near zero in these regions?
Remittance Liquidity and Gold Backing
In Kerala (1.3%), foreign inward remittances from the Persian Gulf provide a continuous, non-debt liquidity buffer. When personal crises hit, Kerala households do not tap unsecured apps; they leverage household gold reserves via short-term loans that carry deep structural collateral.
Structural Under-Banking as a Blessing in Disguise
In Nagaland (0.1%), Mizoram (0.1%), and Sikkim (0.1%), customary land laws prevent commercial banks from seizing tribal land as collateral. Lacking legal avenues to repossess property, institutional lenders avoid pushing aggressive unsecured credit onto these populations. The absence of aggressive credit marketing has insulated these local economies from systemic default.
There is deep wisdom in the rural Indian proverb: “उधार का खाना, मौत का बुलावा” (Eating on borrowed credit is an invitation to doom). India’s economic periphery lives by this code, while its metropolitan centers abandoned it for digital credit lines.
Comprehensive Delinquency Segmentation
A Golden Opportunity: Traditional banks that pull back from saturated metro markets can reallocate liquidity to under-leveraged regions like Odisha, Assam, and Madhya Pradesh, where credit demand is backed by real collateral and disciplined balance sheets.
The 2030–2047 Roadmap: Vision vs. Leverage Reality
India aspires to become a $5 Trillion economy by the close of this decade and a $30 Trillion developed superpower (Viksit Bharat) by 2047. These ambitions cannot be sustained on an unstable credit foundation.
If our urban economic engines remain trapped in short-term debt cycles, household capital formation will dry up. A nation cannot fund massive physical infrastructure projects when its middle class uses credit lines to cover monthly living expenses.
Essential Structural Reforms Before 2030
-
Mandatory Universal Debt-to-Income (DTI) Caps: The central bank must impose strict underwriting limits. No financial institution should issue credit if a borrower’s total monthly debt payments exceed 40% of documented net income.
-
Consolidated National Digital Registry for Small Loans: Regulators must link all BNPL platforms and micro-lending apps to credit bureaus in real time to stop borrowers from taking multiple small loans simultaneously.
-
Reviving Household Financial Savings: Policymakers must rethink taxation on traditional savings. When bank deposits face heavy taxes while speculative market bets receive favorable treatment, households abandon long-term financial discipline.
Verdict & Strategic Call to Action
The numbers leave no room for debate. The claim that India’s economic expansion is completely decoupled from global credit stress is a dangerous myth. The elevated default rates in Maharashtra (2.8%), Delhi (2.6%), and Karnataka (2.5%) are early warning signs of an over-leveraged middle class.
The bill is coming due. Those who plan for it now will survive the coming credit squeeze; those who dismiss it will be wiped out by it.
Your Action Plan: Immediate Directives
-
For Individual Borrowers: Treat every unsecured loan as a potential trap. Prioritize paying off credit cards and personal credit lines immediately. Strive for a household balance sheet where debt servicing consumes less than 25% of net income. Remember: cash and low debt remain your best protection in an economic downturn.
-
For Bank Executives and Risk Officers: Pull back unsecured loan targets across Tier-1 metropolitan branches. Re-underwrite portfolios in Maharashtra, Delhi, and Karnataka with stress-tested assumptions on middle-class wages.
-
For Institutional Investors: Trim exposure to retail-heavy NBFCs and consumer lenders whose books rely on unsecured credit. Rotate capital toward commercial lenders tied to tangible infrastructure and capital goods manufacturing.
The numbers are clear. The only question left is whether we confront this reality today, or let mounting defaults make the decision for us tomorrow.
GOOGLE ‘PEOPLE ALSO ASK’ FAQs
Q1: Which Indian state has the highest loan delinquency rate?
Maharashtra leads national defaults at 2.8%, exceeding the 1.8% baseline by 55.5%. This concentration reflects heavy personal credit saturation, high-leverage lifestyle borrowing, and speculative urban real estate exposure across Mumbai and Pune.
Q2: What is the current national average delinquency rate in India?
1.8% represents the national average default benchmark across all states and union territories. However, Tier-1 industrial powerhouses significantly surpass this threshold, while peripheral agrarian economies anchor the lower boundary below 1.0%.
Q3: Why do southern and western states show higher credit defaults?
2.4% to 2.8% default rates in Maharashtra, Karnataka, and Telangana stem from aggressive unsecured app lending and tech-corridor wage stagnation. In contrast, peripheral economies avoid high delinquencies due to remittance cushions and limited unsecured banking penetration.
Q4: How could rising urban loan defaults impact India’s 2030 economic targets?
A 120 to 150 basis point reduction in annual GDP growth could emerge if metropolitan defaults trigger systemic bank risk-aversion. Elevated debt-servicing erodes middle-class capital formation, directly stalling the capital expenditure required for a $5 Trillion economy.
Q5: What measures can mitigate retail loan default risks by 2030?
A 40% cap on universal Debt-to-Income (DTI) ratios must be mandated across all commercial lenders. Additionally, central regulators require real-time bureau integration for Buy-Now-Pay-Later platforms to stop runaway multi-app credit stacking.
Data Source:
- Reserve Bank of India (RBI)
- TransUnion CIBIL
- Ministry of Statistics and Programme Implementation (MoSPI)
Disclaimer: This report is for informational and analytical purposes only and does not constitute formal financial, investment, or policy advice.