The 409 Million Crucible: India’s General Category Population Dynamics, Economic Stratification, and the 2047 Capital Architecture
NEW DELHI, India — Beneath the roaring headlines of India’s $4.1 Trillion GDP and the intoxicating rhetoric of the Vision 2047 economic miracle lies a staggering demographic and structural reality that policymakers and institutional analysts whisper about behind closed doors: the General Category population of 409.88 Million in 2025 represents the foundational capital, entrepreneurial engine, and most heavily taxed economic shock-absorber of the subcontinent, yet it operates within an environment of severe asset polarization, mounting fiscal pressure, and structural obsolescence.
When 409,880,000 citizens constituting roughly 29.8% of the nation’s 1.44 Billion populace anchor the primary taxable base, drive higher education enrollment, and fuel urban private consumption, their microscopic geographical distribution and wealth concentration dictate whether India achieves developed-nation status by 2047 or stalls irrevocably in the dreaded middle-income trap. This investigation dissects the raw projections from Census 2011 baselines, maps state-level demographic powerhouses, contrasts Indian economic realities against the USA, China, Germany, UK, and Japan, and lays bare the cold, unvarnished math of our national trajectory.
The Demographic Architecture: Mapping the 409.88 Million General Category Core
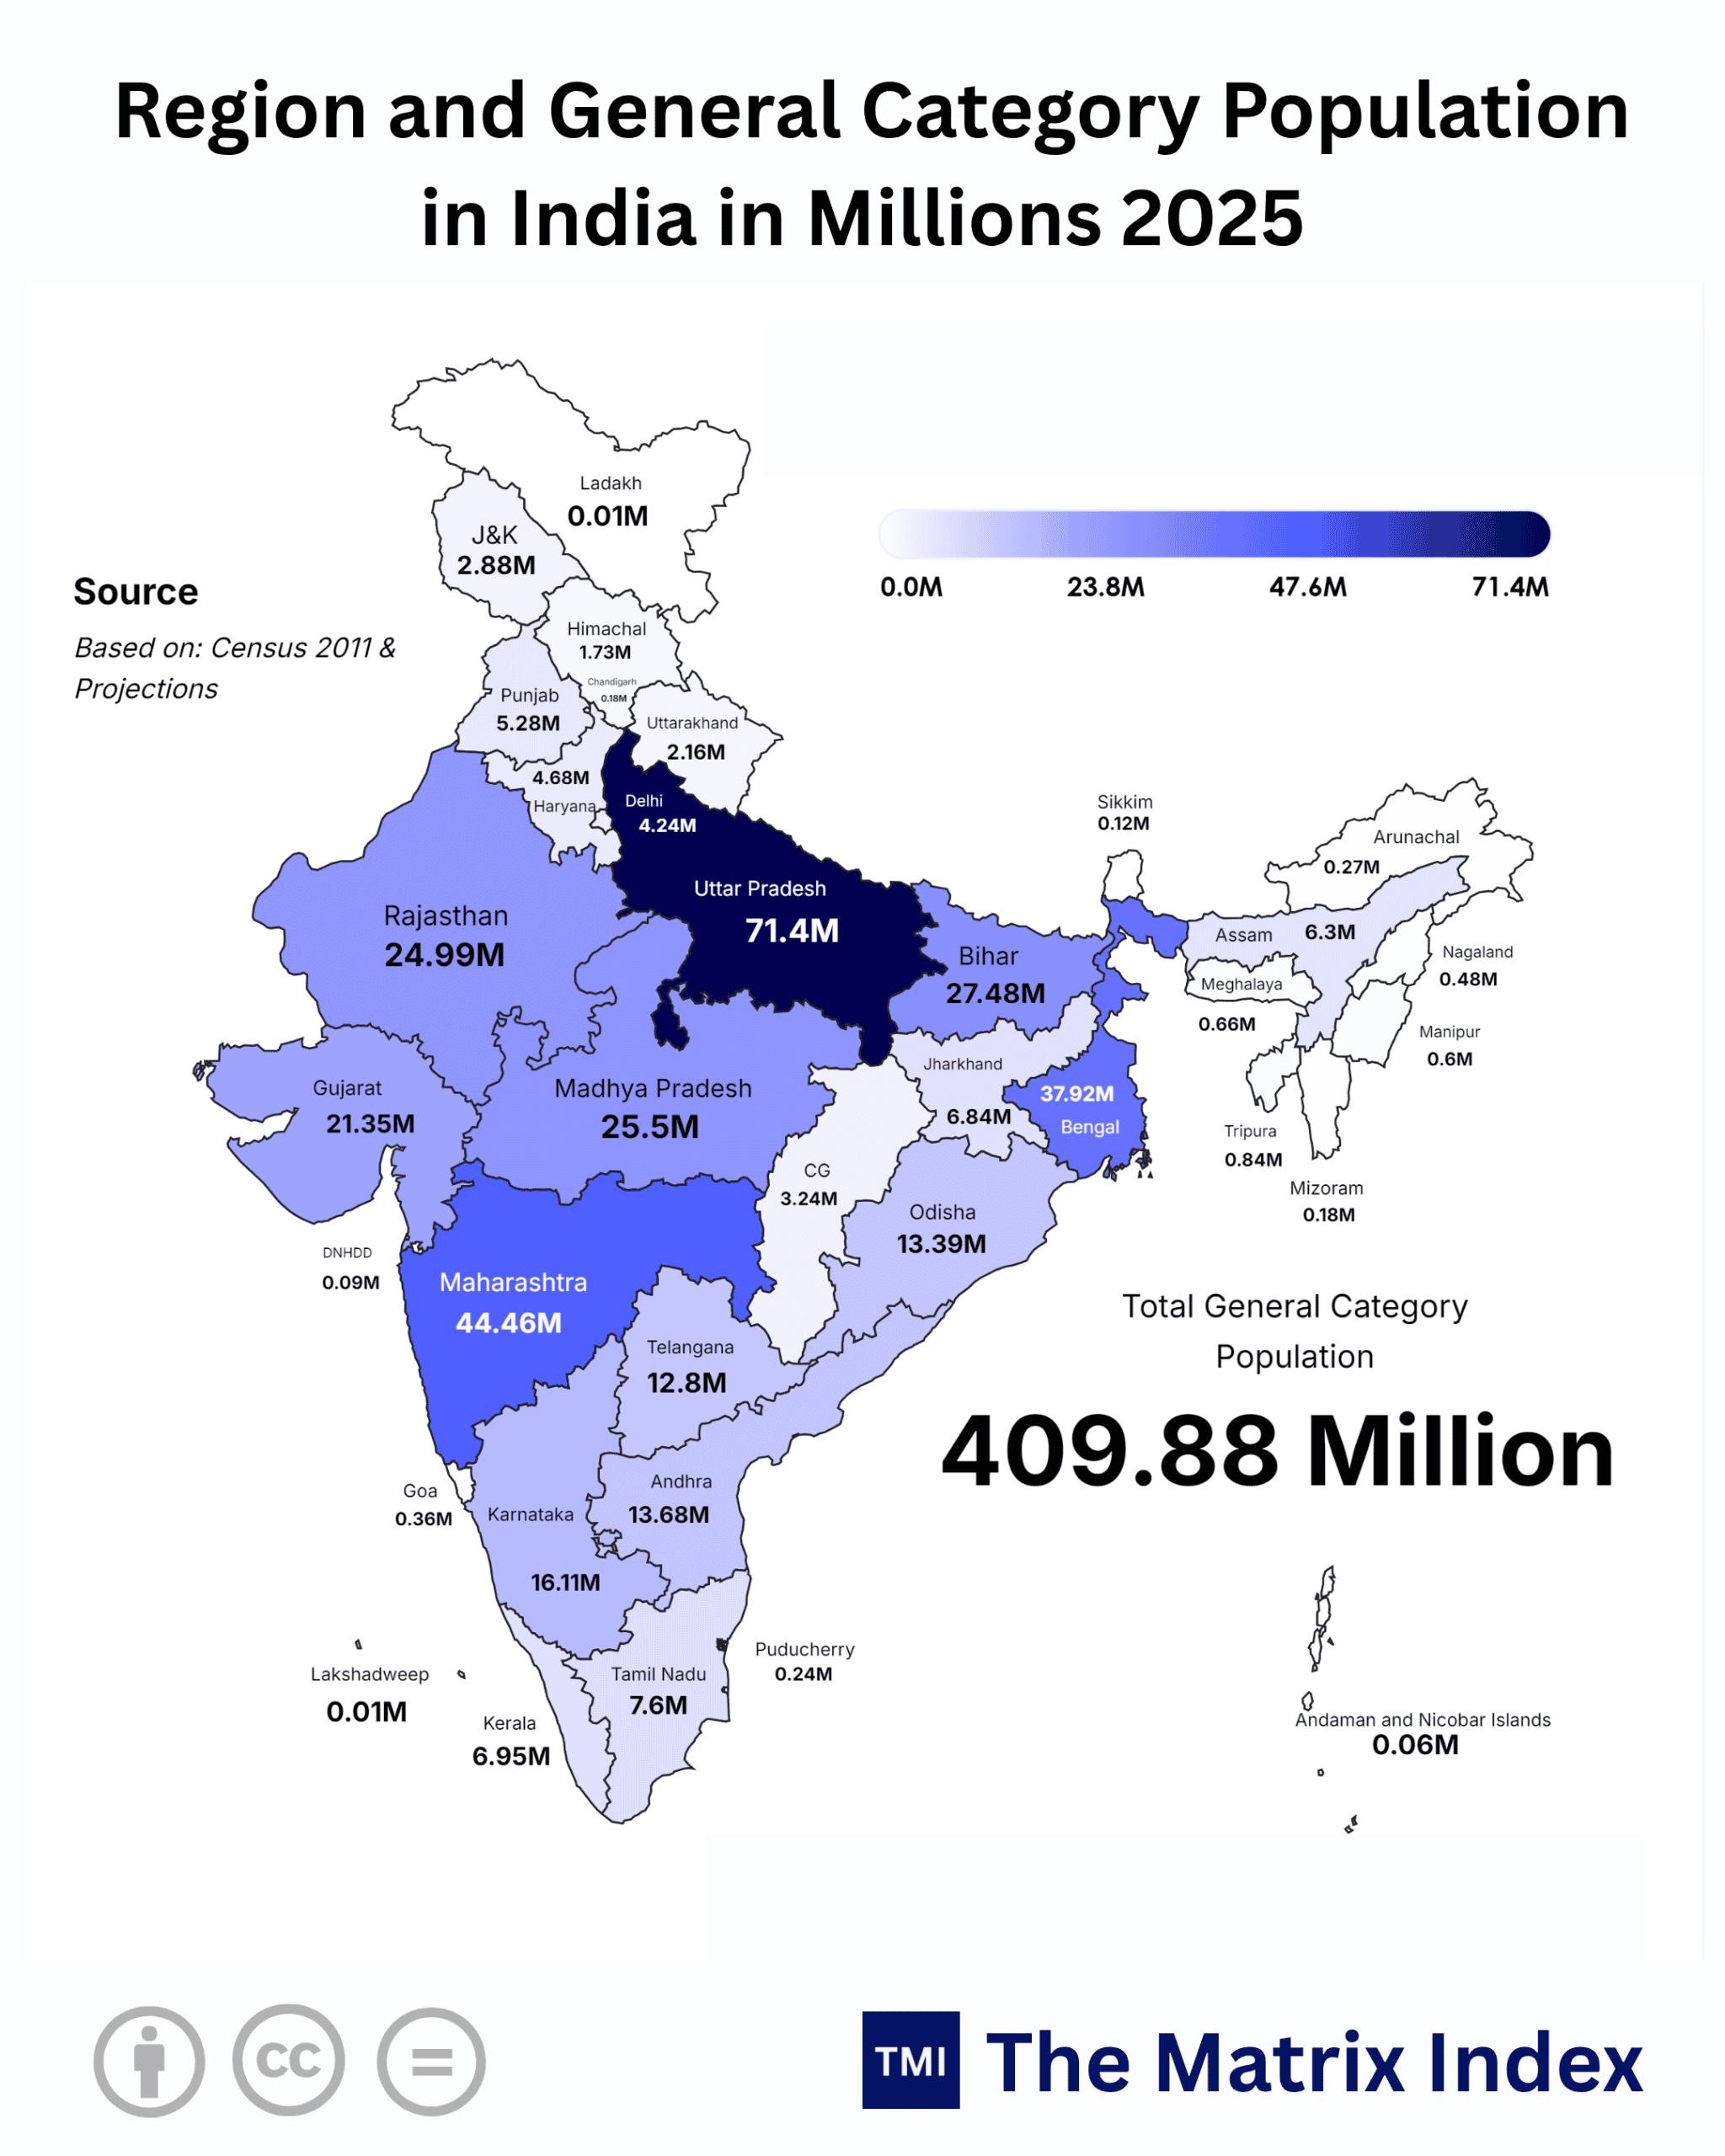
According to the latest 2025 demographic projections derived from Census 2011 trends, India’s General Category population stands at exactly 409.88 Million. To put this in global perspective, this single demographic segment within India is larger than the entire population of the United States (342 Million), Germany (84 Million), and the United Kingdom (67 Million) combined.
Yet, unlike homogeneous Western societies or centrally planned economies, this vast demographic mass is geographically hyper-concentrated, economically fractured, and politically fragmented across 28 States and 8 Union Territories.
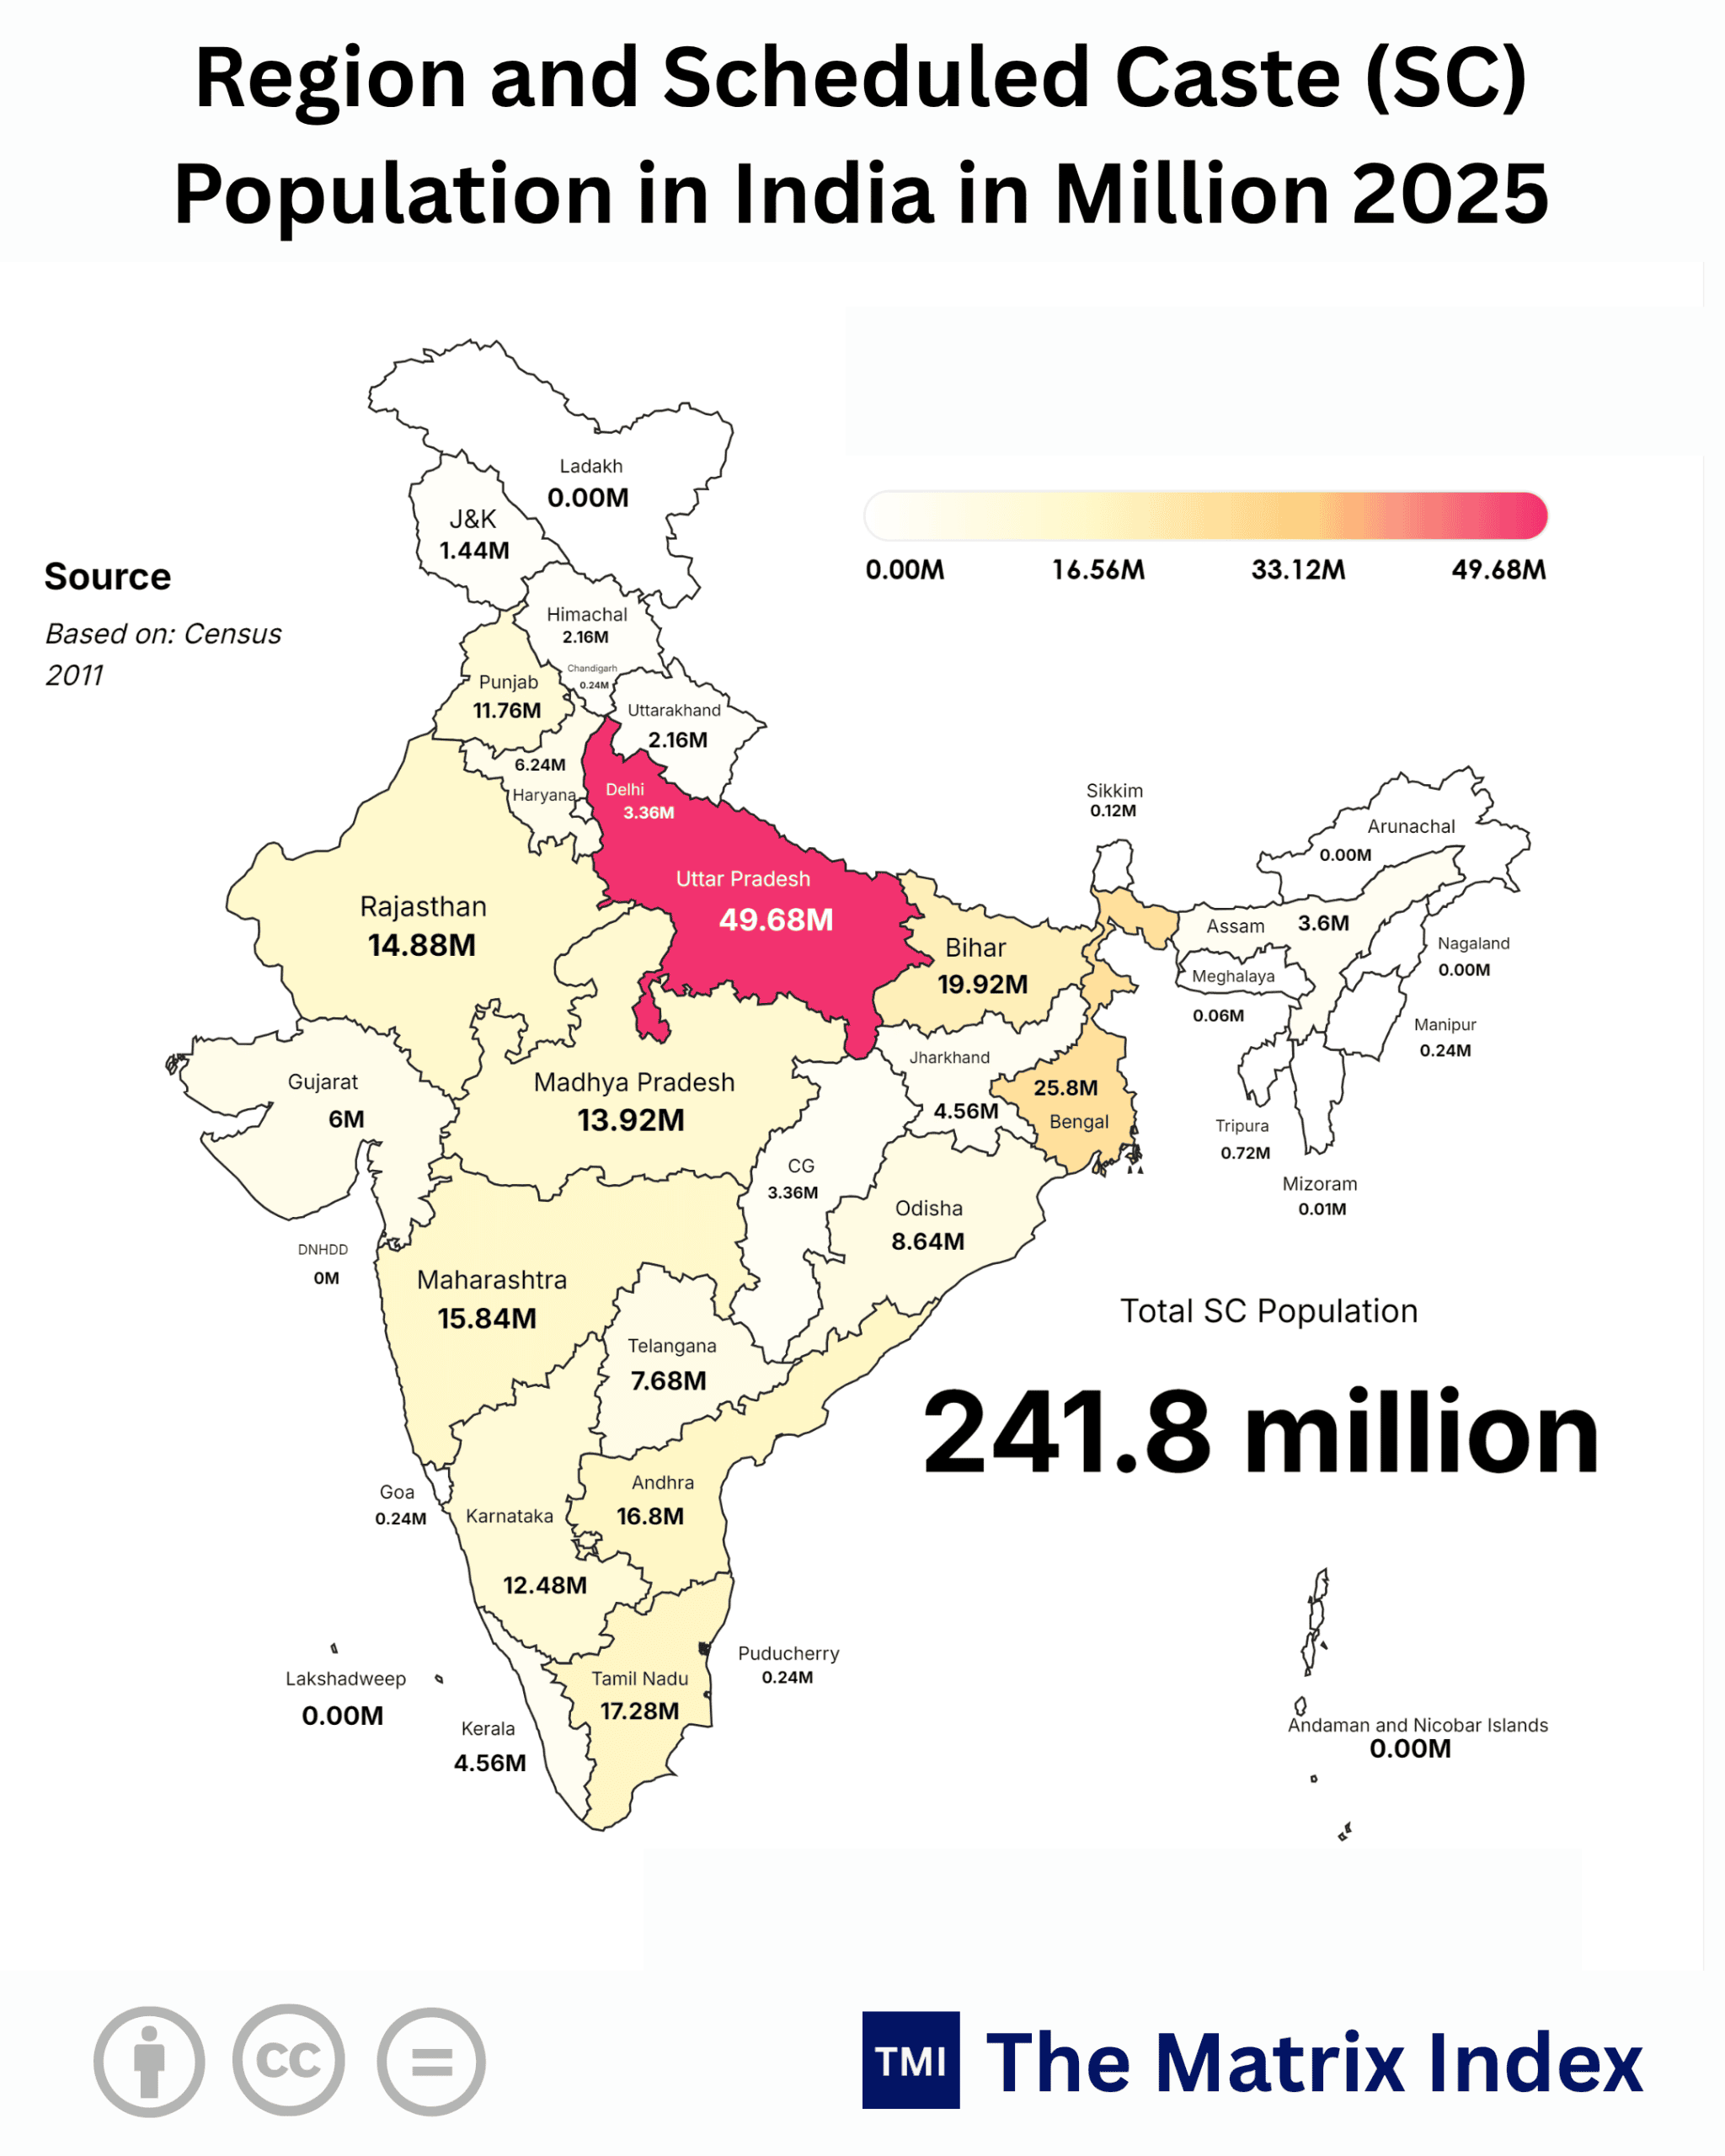
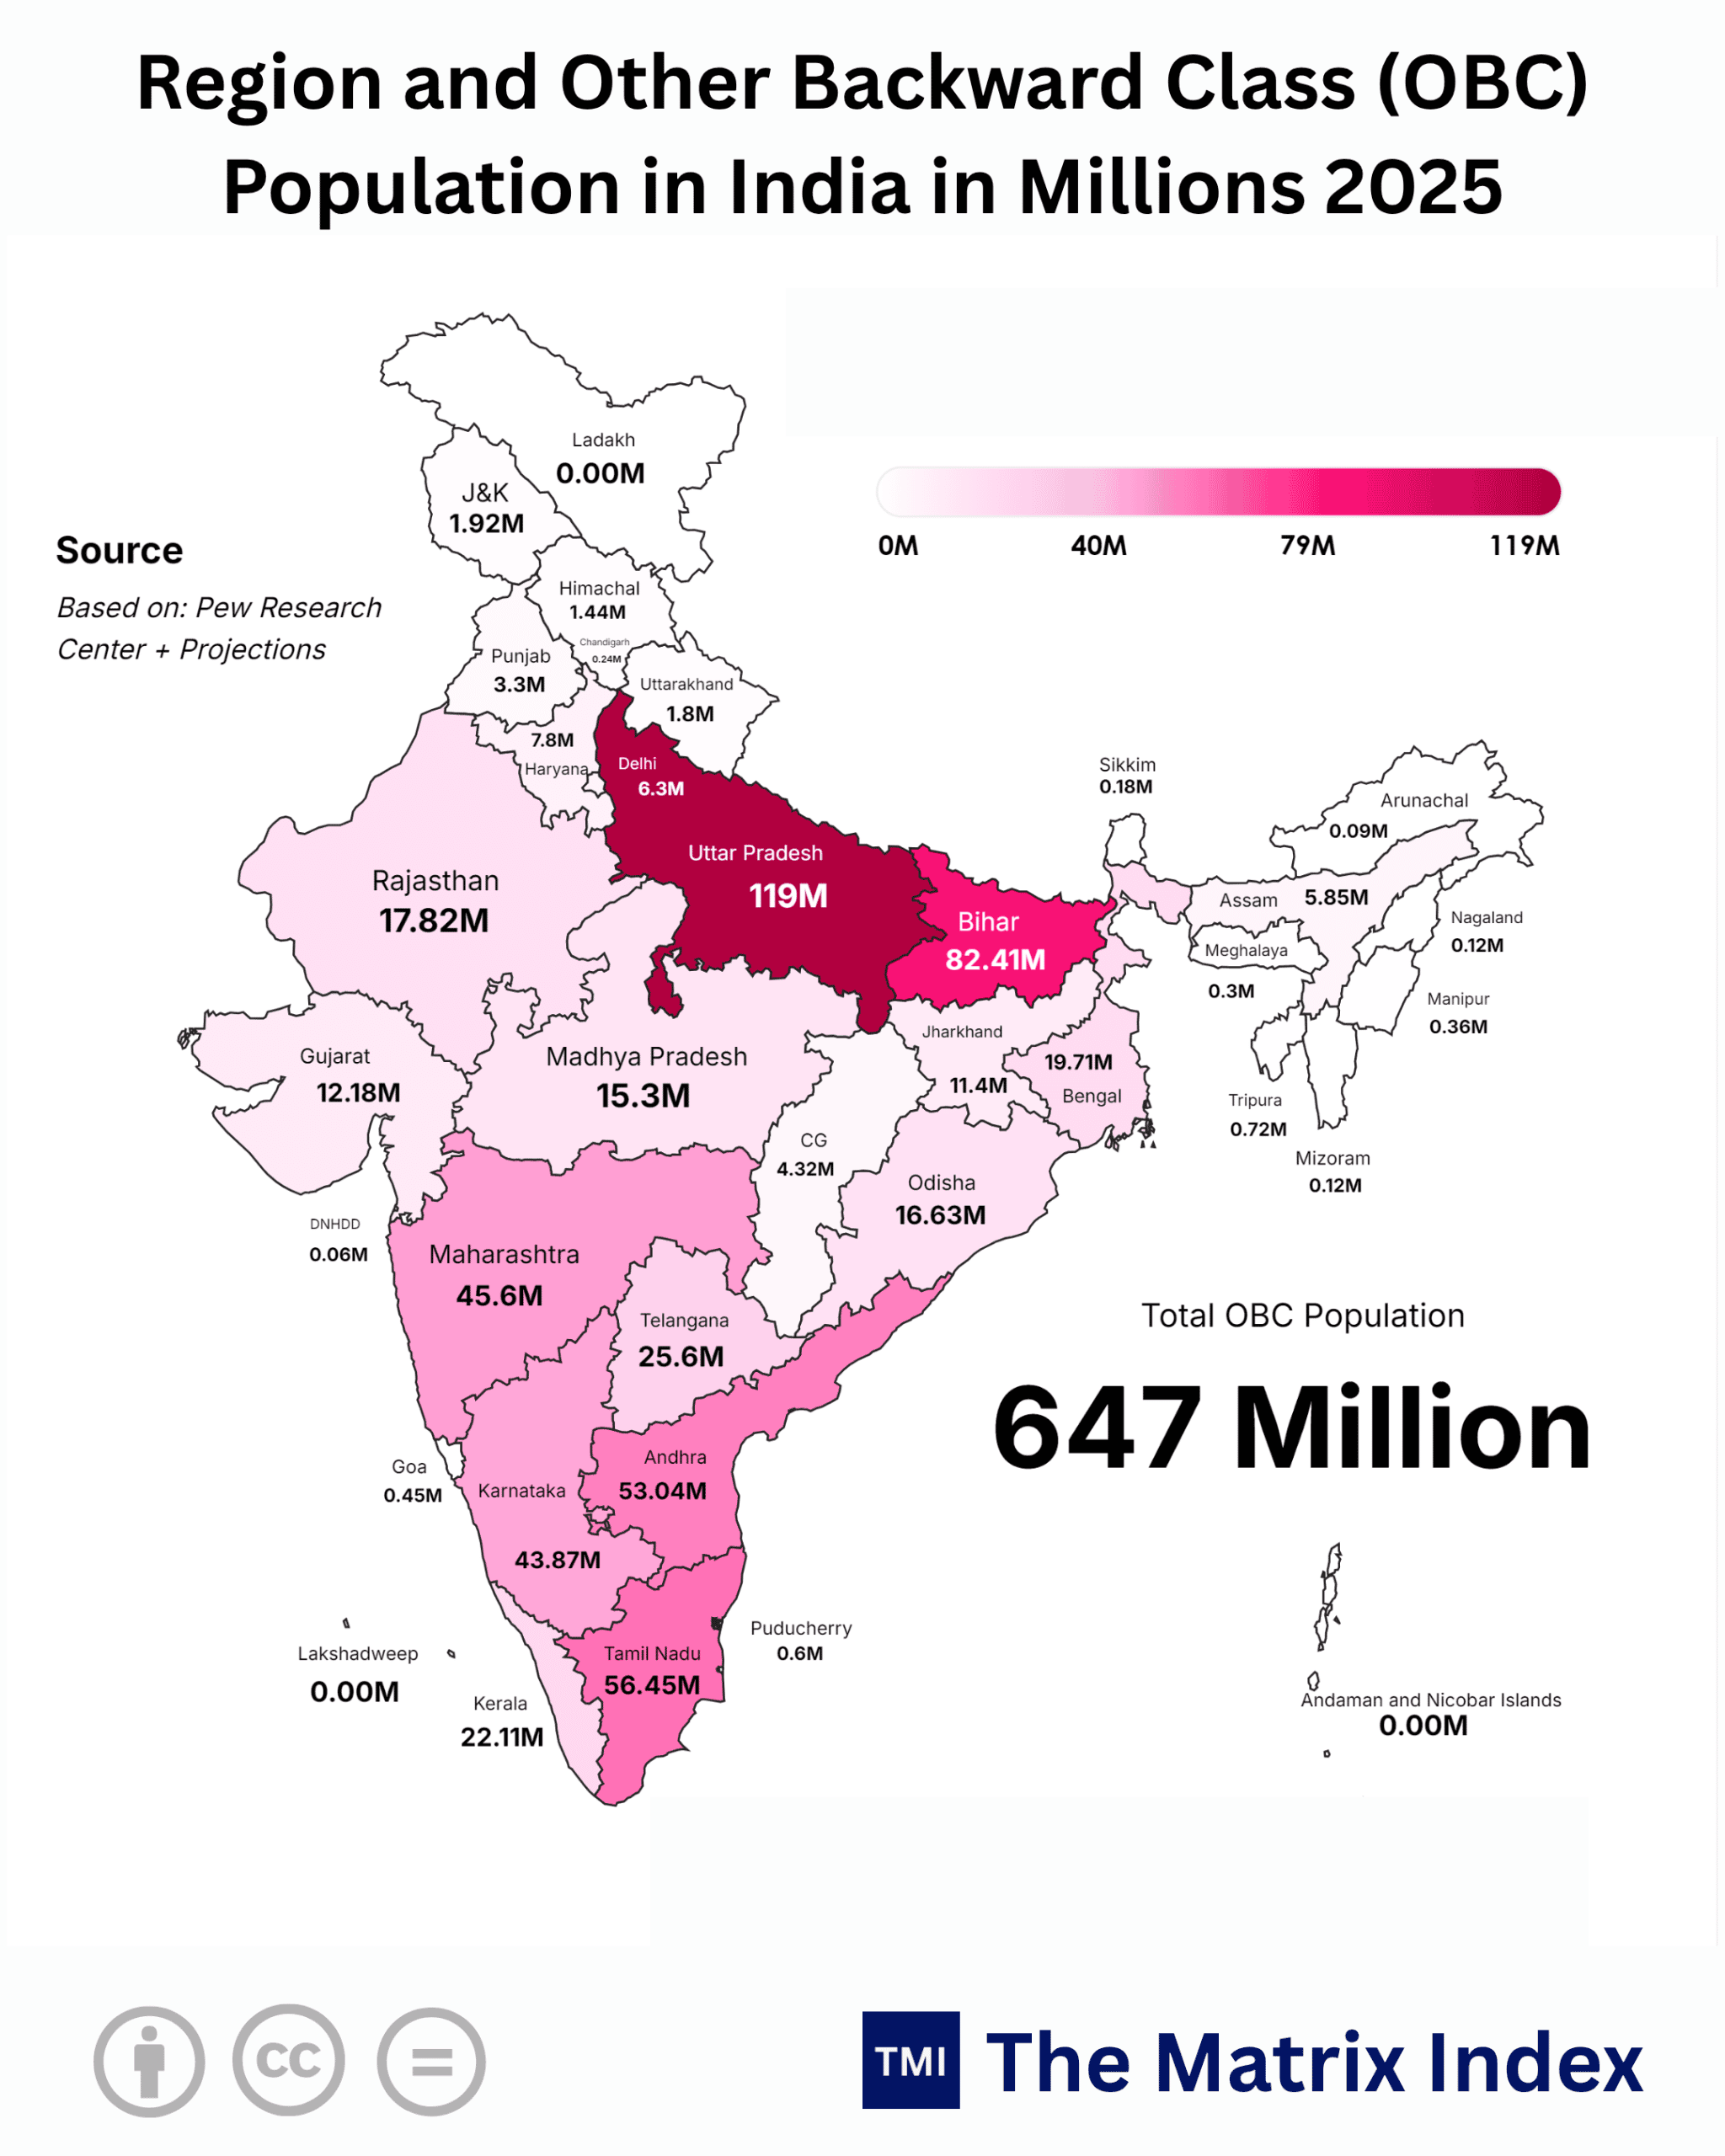
Consider the heavyweights of this demographic map. Uttar Pradesh alone commands a General Category population of 71.40 Million representing over 17.42% of the entire national total for this stratum. Following closely behind is Maharashtra at 44.46 Million (10.85%), West Bengal at 37.92 Million (9.25%), Bihar at 27.48 Million (6.70%), Madhya Pradesh at 25.50 Million (6.22%), and Rajasthan at 24.99 Million (6.10%).
These six states alone account for 231.75 Million, or more than 56.5%, of the total General Category populace across the Republic.
The “So What?” Factor: The Ripple Effect on Urban India
This population forms the backbone of northern India’s formal workforce, SME ownership, and professional services demand. When rural distress or fiscal tightening hits this specific demographic, urban real estate absorption in Noida, corporate hiring in Gurugram, and consumer discretionary spending across Tier-1 retail hubs plummet within two quarters.
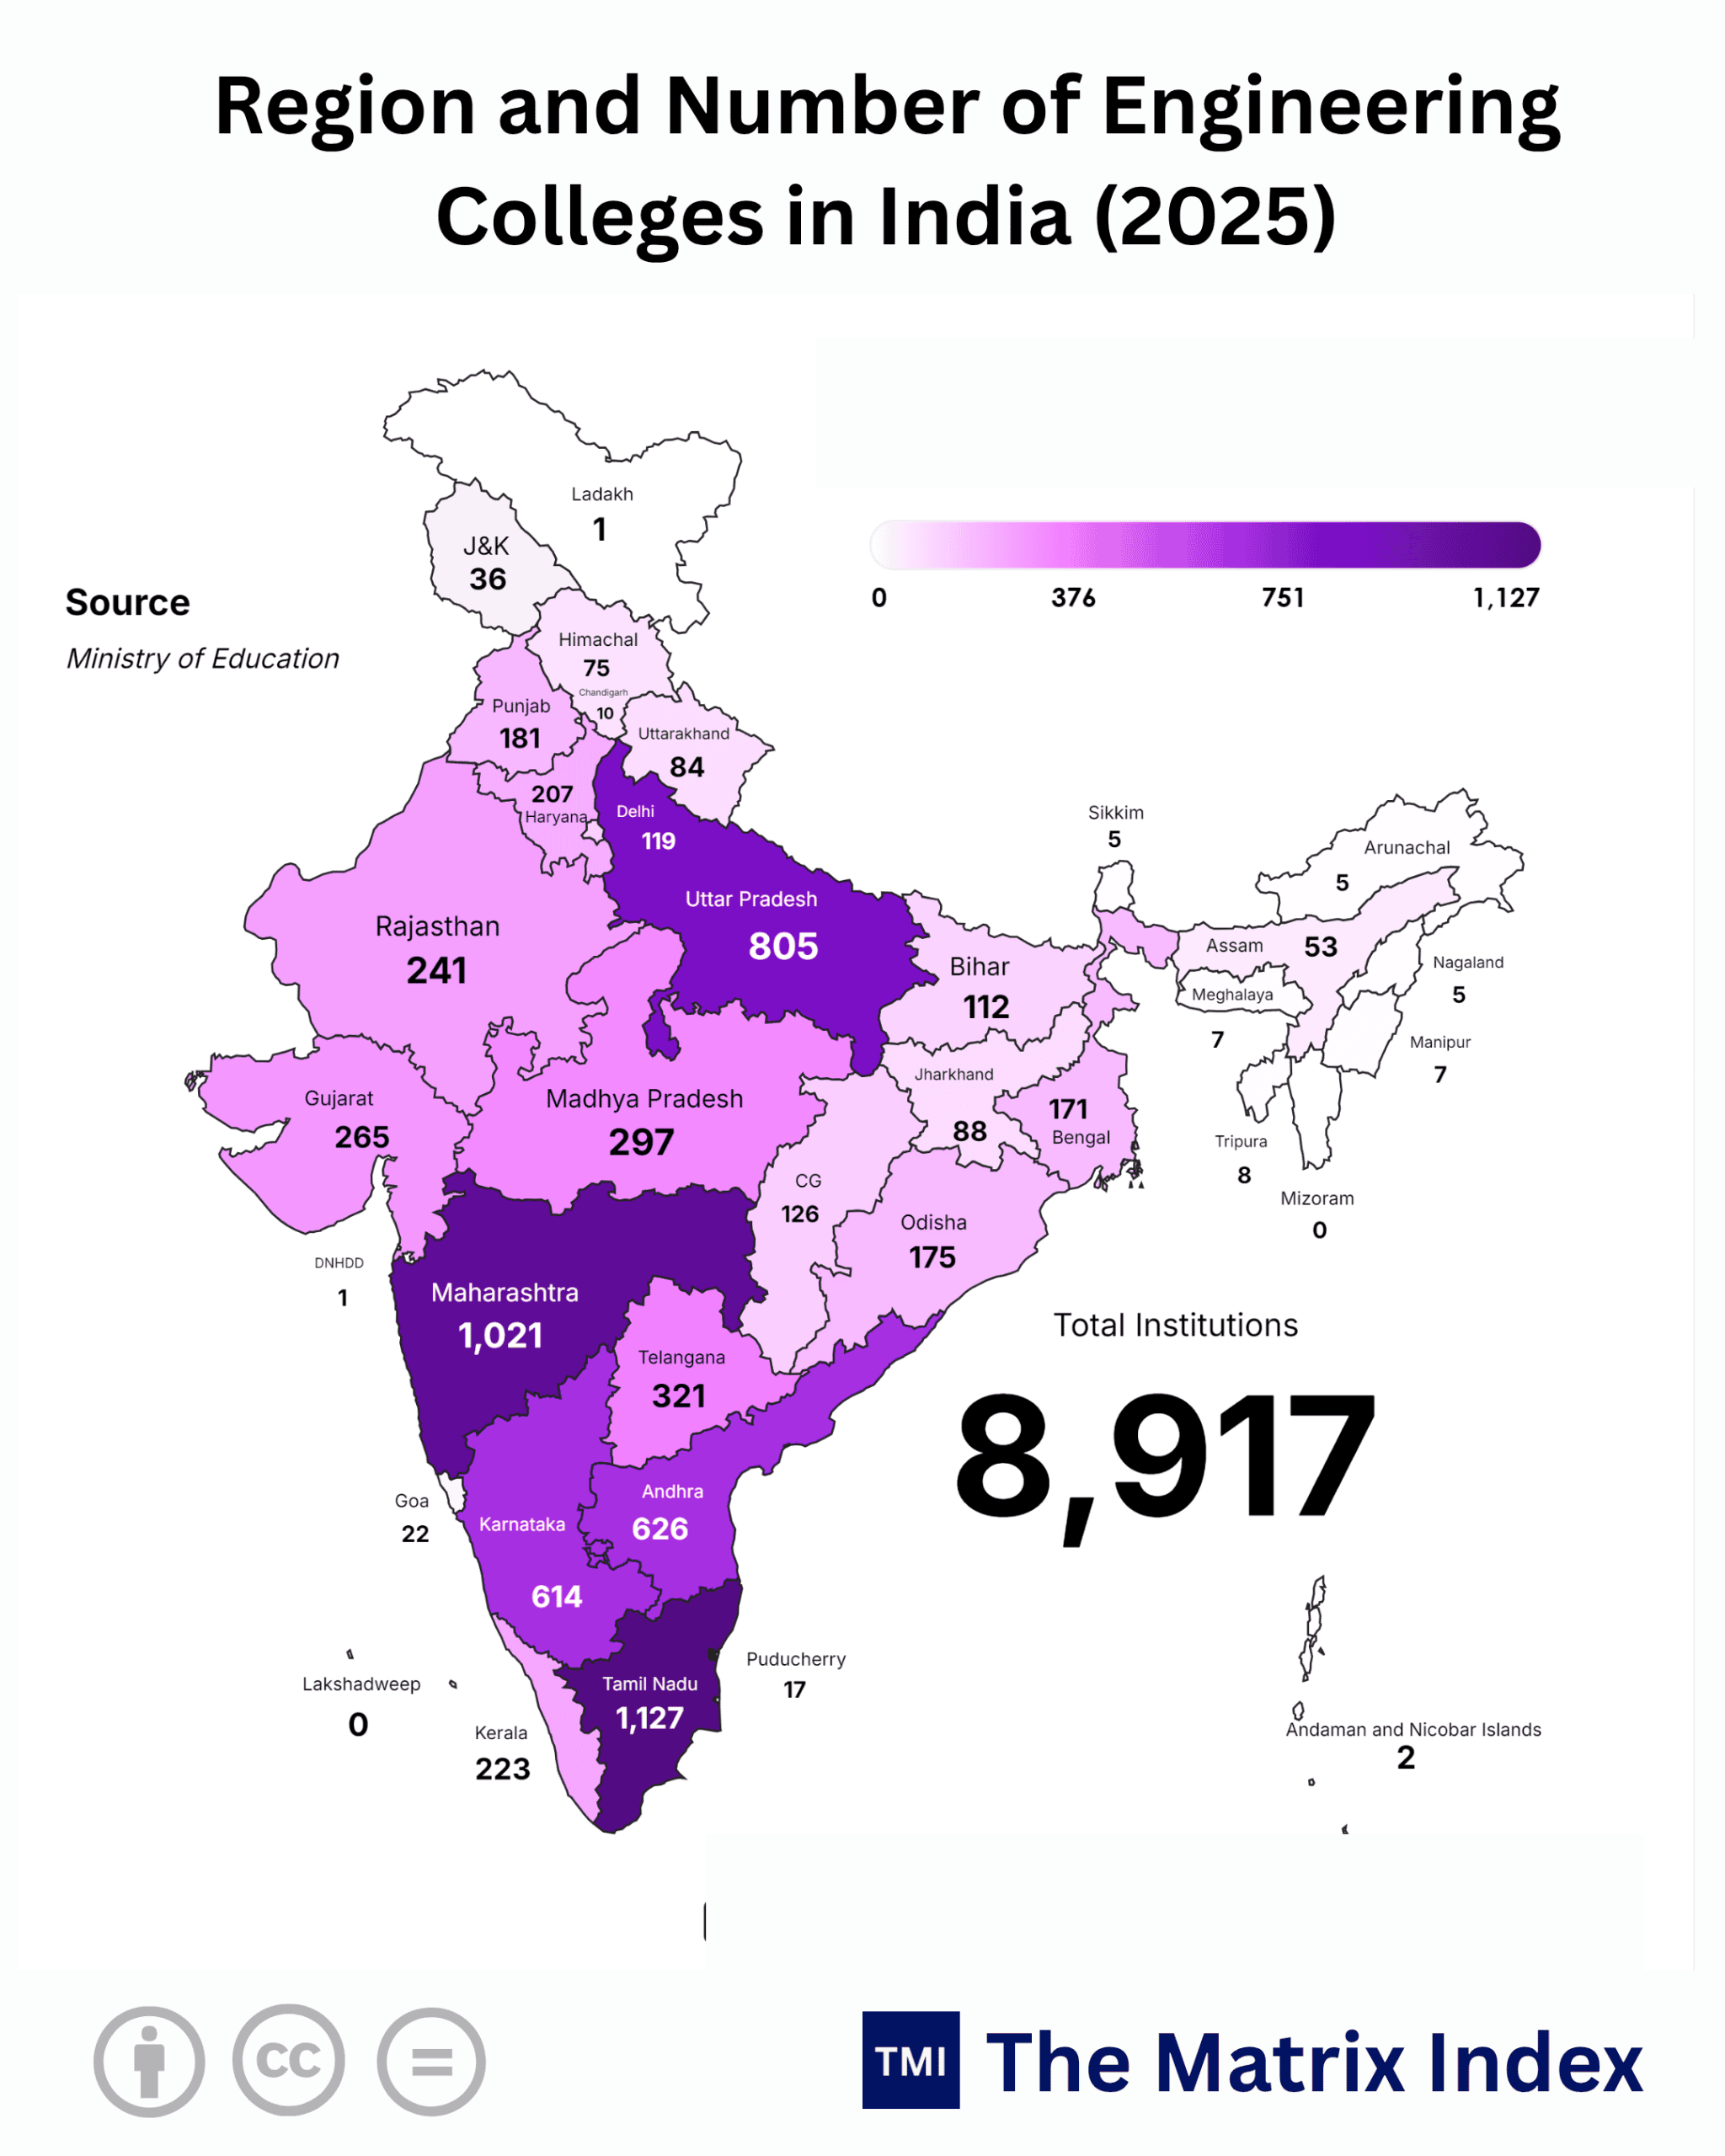
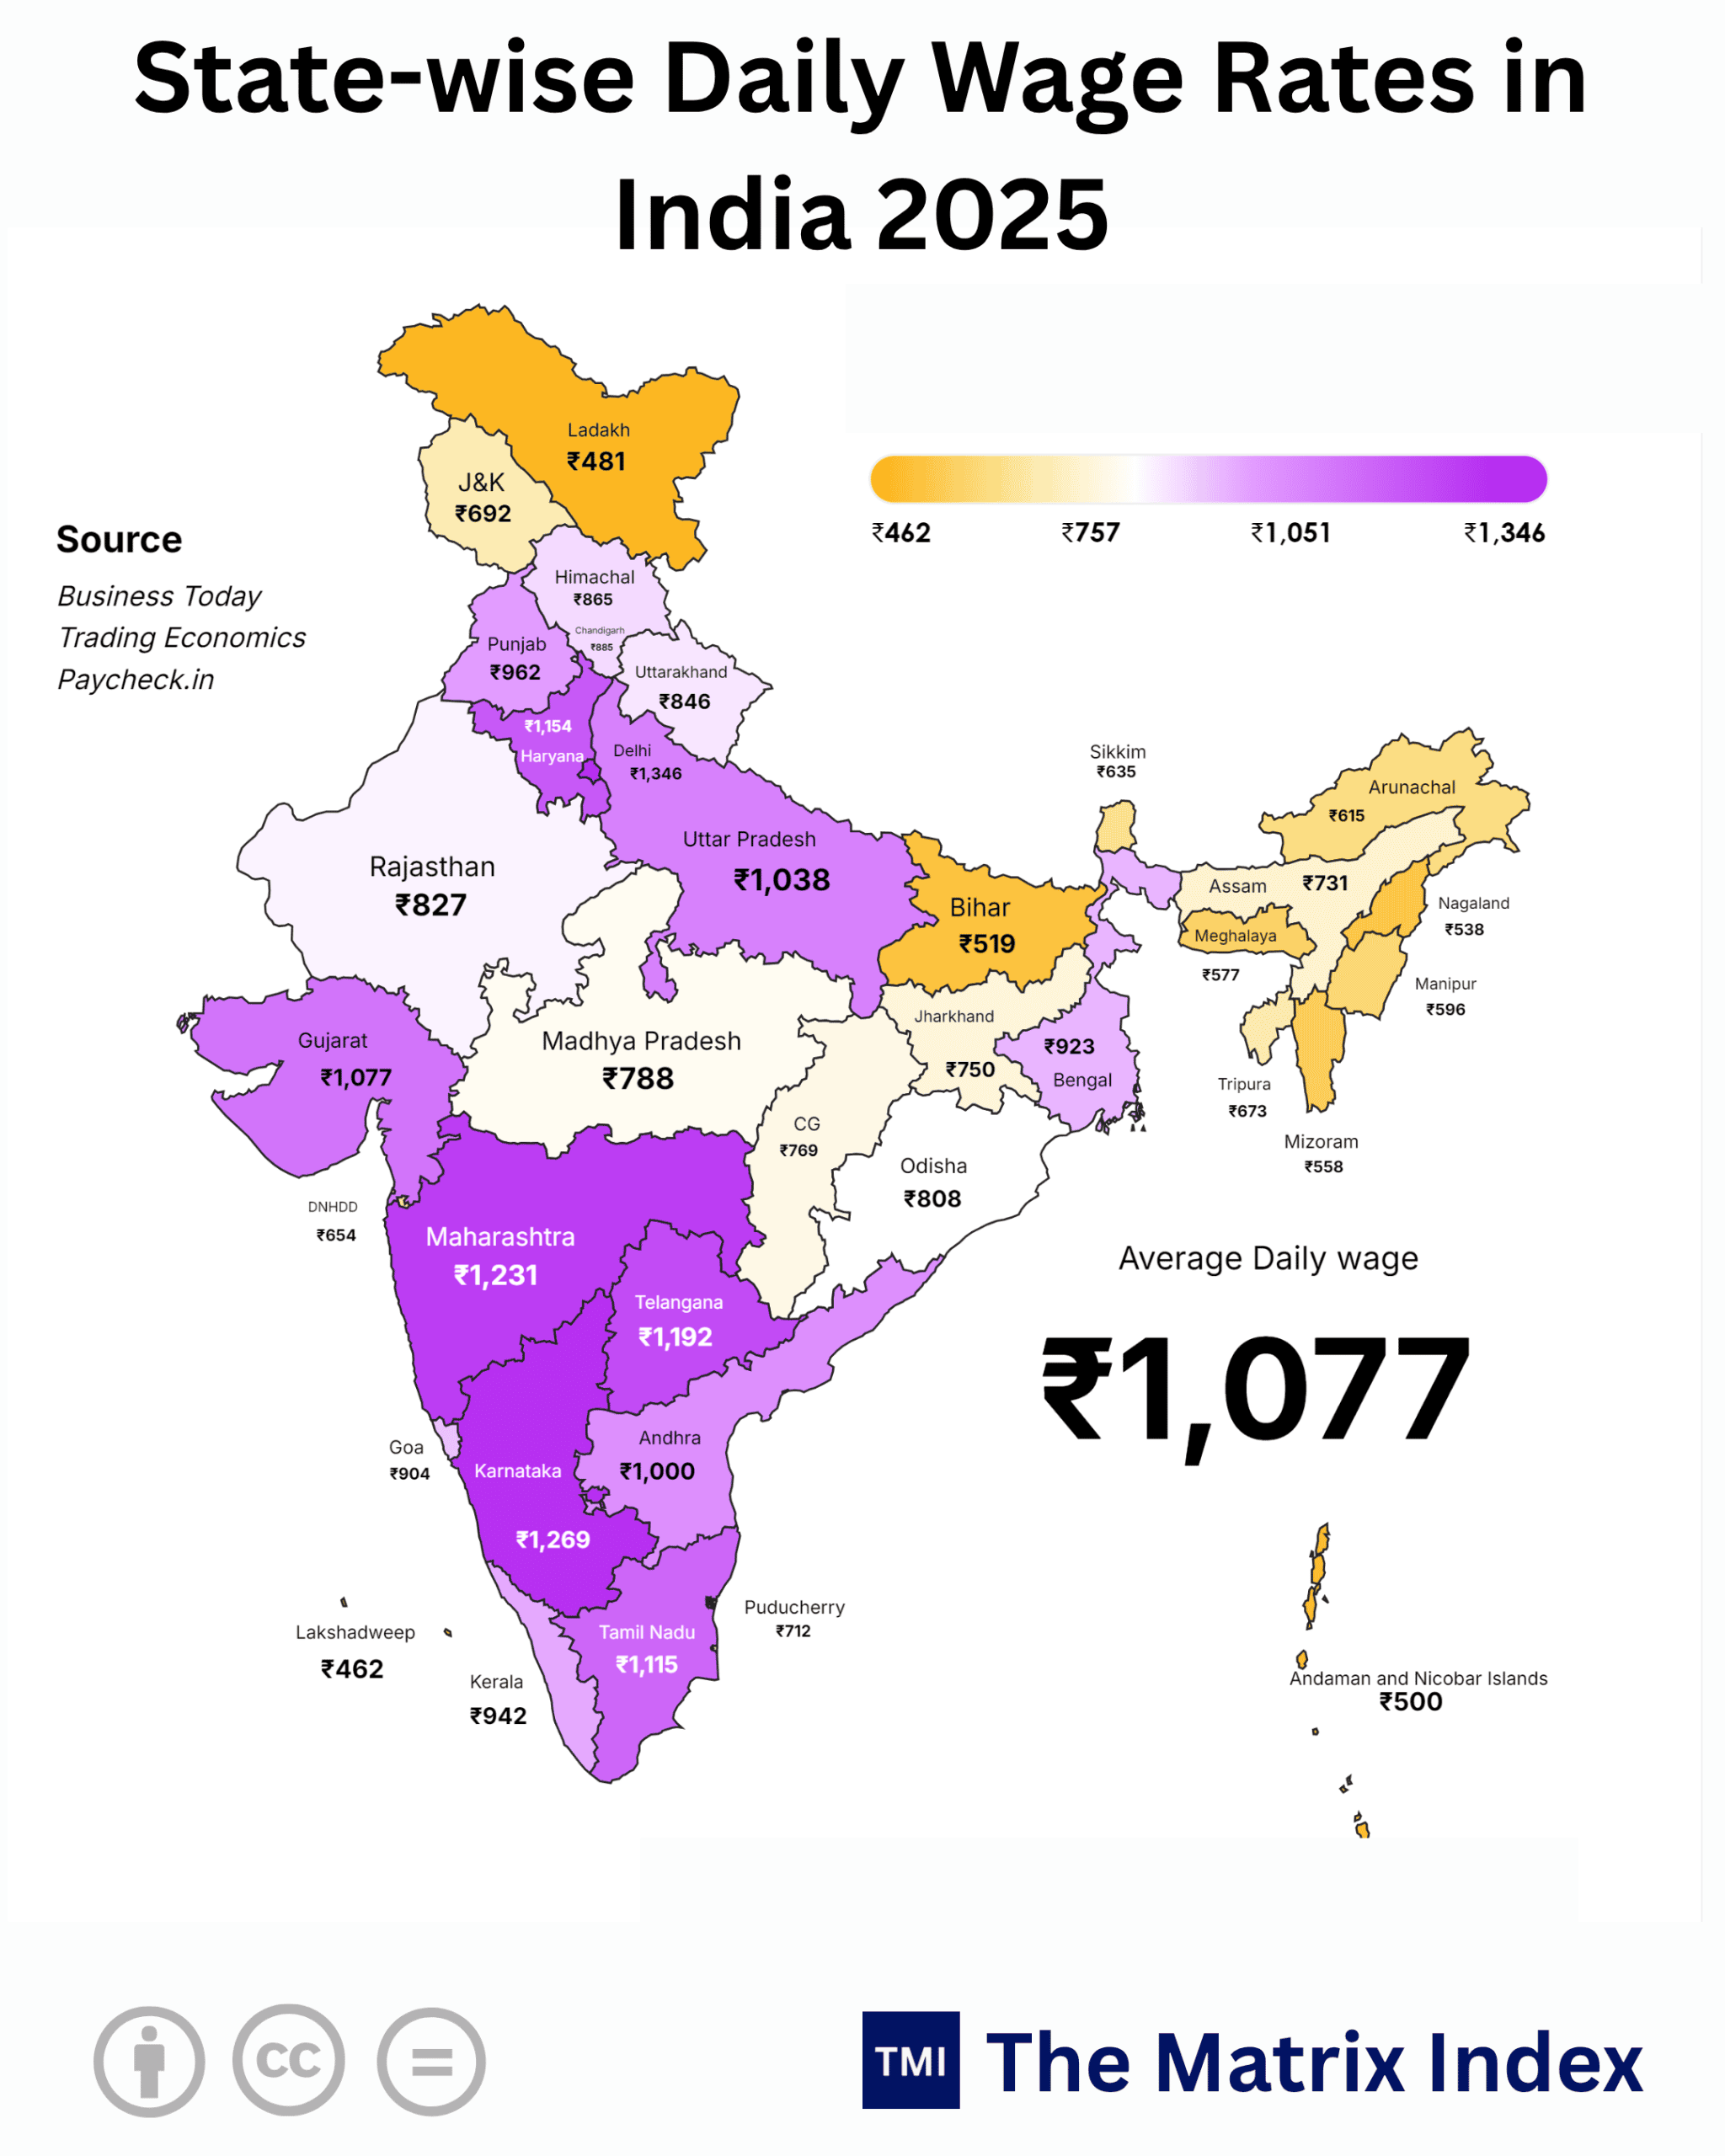
When we examine the southern and western powerhouses such as Gujarat (21.35 Million), Karnataka (16.11 Million), Andhra Pradesh (13.68 Million), Tamil Nadu (7.60 Million), and Kerala (6.95 Million) a sharp divergence emerges. The southern states exhibit lower absolute general category headcounts due to historical demographic shifts and lower fertility rates, yet they command disproportionate shares of India’s formal corporate output, technology exports, and per capita income.
State-Wise Distribution Matrix of General Category Population (2025 Projections)
(Bitter Truth): Wealth is geographically anchored in industrial corridors of the West and South, while human capital aspirations remain trapped in agrarian stagnation across the populous northern heartland.
Global Anchoring: How India’s 410M Core Compares with G7 and BRICS Models
To evaluate the economic viability and resilience of India’s 409.88 Million general population, we must benchmark it against global economic structures. In the United States, the middle and upper-middle class constitutes roughly 50% of a 342 Million population, supported by deep institutional credit, robust social security, and progressive taxation frameworks. In China, a population of 1.41 Billion has transitioned over 450 Million citizens into an urban middle class, heavily subsidized by state-directed industrial policy and massive infrastructure spending.
India’s general category population occupies a peculiar, high-stress thermodynamic zone. Unlike the Western middle class in Germany or the United Kingdom, which enjoys comprehensive state healthcare and public schooling safety nets, India’s 410 Million general populace finances its own healthcare, higher education, and retirement through private out-of-pocket expenditures, while bearing the brunt of direct personal income taxes and indirect Goods and Services Tax (GST).
According to Reserve Bank of India (RBI) and Ministry of Finance data, less than 3.2% of India’s total population files effective income tax returns, and the overwhelming majority of this tax burden falls squarely on the salaried and professional segments of the General Category.
The “So What?” Factor: The Squeeze on Discretionary Capital
When headline inflation prints at 6.5% and food inflation spikes due to erratic monsoons, the urban and semi-urban general category household does not receive state food subsidies. They absorb price shocks by cutting discretionary savings, reducing insurance premiums, and delaying residential property purchases directly choking the financialization of household savings and starving capital markets of sticky domestic retail liquidity.
Global Economic & Demographic Comparative Matrix (2025–2026 Estimates)
(Bitter Truth): India’s strategic economic backbone is carrying Western-style fiscal tax burdens on a lower-middle-income per capita earnings base without the cushion of European-style social welfare infrastructure.
Seasonality, Anomalies, and the Debt-Financed Consumption Trap
Economic indicators in India often mask structural friction behind festive-season spikes and short-term credit booms. During the third quarter (Q3) of every fiscal year, retail sales surge, vehicle registrations spike, and digital payment volumes cross record milestones.
Beneath this surface glitter lies a critical anomaly: unsecured retail lending comprising personal loans and credit card debt has grown at over 25% CAGR between 2023 and 2025, driven largely by urban general category households attempting to maintain pre-inflation living standards amidst stagnant real wage growth.
This is fundamentally debt-financed consumption. When young professionals in Bengaluru, Pune, and Gurugram leverage future earnings to fund lifestyle expenditures against persistent CPI inflation hovering around 5.2% to 6.0%, systemic financial exposure widens exponentially. The RBI has issued repeated warnings regarding risks in unsecured lending, as structural stagnation of real wage growth in traditional corporate sectors leaves households with few alternatives.
The “So What?” Factor: The Looming Credit Contraction
Reported quarterly corporate revenue growth is heavily fueled by debt rather than organic wage expansion. If interest rates remain elevated or central banks tighten liquidity further, loan defaults among urban professionals will rise sharply, triggering credit contractions across retail banking, automobile manufacturing, and consumer durables.
The fear of missing out (FOMO) on property ownership and equity rallies pushes retail investors into high-risk speculative instruments derivatives trading (F&O), crypto assets, and unregulated collective schemes while fixed-income yields struggle against post-tax inflation. As the time-tested adage warns: “He who buys what he does not need, must soon sell his necessaries.”
Two-Sided Risk Assessment: Bull Case vs. Bear Case for 2030–2047
To maintain analytical rigor, we must evaluate the trajectory of this 410 Million demographic engine across two distinct economic futures.
Bull Case: The Demographic Dividend Realized
-
Industrial Scale: Manufacturing contribution to GDP rises from 17% to 25% through aggressive Production-Linked Incentive (PLI) schemes, with semiconductor fabrication plants in Gujarat and Karnataka reaching commercial maturity.
-
Logistical Efficiency: Dedicated freight corridors, high-speed rail networks, and port modernization reduce logistics costs from 14% to 8% of GDP, unlocking global export competitiveness.
-
High-Value Output: The general category population acts as the managerial and technical catalyst across Artificial Intelligence (AI), green hydrogen, advanced precision engineering, and Global Capability Centers (GCCs).
-
Income Expansion: Per capita income breaches $6,000 by 2030 and approaches $15,000 by 2047, transforming India into a premier global innovation hub with deep domestic consumption.
Bear Case: The Middle-Income Trap and Brain Drain
-
Human Capital Deficit: Outdated educational curricula and institutional inertia continue to produce graduates lacking technical acumen, entrenching structural underemployment among educated youth.
-
Capital & Talent Flight: Stagnant real wages, elevated metro real estate valuations, and heavy indirect taxation accelerate talent emigration to North America, Europe, and East Asia, draining critical entrepreneurial capital.
-
Savings Depletion: Middle-class household savings are systematically eroded by double-digit private healthcare inflation and higher education debt.
-
Credit Shocks: Unsecured retail defaults trigger non-performing asset (NPA) spikes in commercial banks, leaving India aging before achieving broad-based affluence.
The “So What?” Factor: Institutional Valuation Re-rating
If the Bear Case materializes, metro real estate valuations face a 30%–40% structural correction, private equity deployment will slow to a crawl, and multinational consumer brands will face unviable unit economics due to an evaporating consumer surplus.
The Alternative Scenario: Geopolitical Fractures and Policy Realignment
In the event of escalating global trade barriers, protectionist industrial policies in Western markets, or severe energy supply shocks arising from conflicts in the Middle East or the South China Sea, India’s export-led growth models would face immediate, severe friction.
To insulate the domestic economy under such an alternative scenario, national economic strategy must pivot radically toward domestic demand generation and deep agricultural-industrial integration.
Policymakers would need to rationalize regressive tax structures on middle-class income earners, aggressively incentivize domestic Research & Development (R&D) over low-margin assembly, and overhaul archaic judicial mechanisms for commercial contract enforcement. Without such proactive domestic structural reforms, external disruptions will quickly expose the severe vulnerabilities of internal consumption engines.
Regional Vulnerabilities and Catalysts
Regional Demographic & Economic Vulnerability Matrix
(Golden Opportunity): Strategic decentralization of industrial corridors into Tier-2 and Tier-3 cities can unlock dormant productivity across agrarian states, transforming regional liability into localized manufacturing powerhouses.
In states like Punjab and Haryana, where conventional agricultural models face hard ecological ceilings from groundwater depletion, youth populations face a pivotal juncture: distress emigration or entrepreneurial pivots into advanced manufacturing and tech-enabled services.
My Verdict: The 2030–2047 Roadmap and Strategic Call-to-Action
India’s path toward its 2047 centenary will not be decided by headline market index peaks alone, but by the financial resilience, skill modernization, and fiscal fairness extended to its 409.88 Million general category citizens.
Persisting with punitive direct taxation on this segment without reciprocal social safety nets risks entrenching talent drain and capital flight. Conversely, rationalizing personal income tax brackets, revitalizing higher education quality, and deepening credit access for small and medium enterprises will create a sustainable, self-reinforcing domestic growth cycle.
My Verdict: The window for structural adjustments is closing rapidly between 2026 and 2030. Decision-makers must re-allocate state resources toward decentralized regional manufacturing, domestic R&D, and skill-intensive industries before demographic aging sets in.
Strategic Call-to-Action for Decision-Makers
-
For Policymakers: Rationalize personal income tax slabs and narrow the glaring gap between indirect consumption levies (GST) and direct tax burdens on salaried earners to rebuild middle-class balance sheets.
-
For Corporate Leaders: Shift hiring frameworks away from legacy credentials toward applied technical capabilities, investing heavily in continuous workforce upskilling and proprietary R&D.
-
For Investors: Hedge against domestic consumption volatility by increasing portfolio exposure to export-oriented manufacturing, green infrastructure, and defensive healthcare assets.
GOOGLE ‘PEOPLE ALSO ASK’ FAQs
Q1: What is India’s General Category population size?
409.88 Million citizens comprise India’s General Category stratum, representing roughly 29.8% of the national populace. This demographic core exceeds the combined populations of the United States, Germany, and the United Kingdom.
Q2: Which Indian state holds the largest General Category population?
71.40 Million citizens reside in Uttar Pradesh alone, accounting for 17.42% of the national General Category total. Maharashtra follows with 44.46 Million, anchoring critical industrial, manufacturing, and financial services output.
Q3: How does India’s direct taxpayer base compare globally?
~3.2% of the population files effective income tax returns in India, heavily concentrating fiscal liabilities onto salaried General Category professionals. In contrast, direct tax compliance exceeds 45% in the United States and 48% in Germany.
Q4: Why is unsecured retail lending a structural risk in India?
25% CAGR growth in unsecured debt between 2023 and 2025 highlights credit-financed consumption among urban middle-class households. Persisting inflation and real wage stagnation heighten systemic default exposure across retail banking.
Q5: What are the primary economic targets for Vision 2047?
$15,000 per capita GDP and 25% manufacturing share anchor India’s 2047 high-income roadmap. Realizing this dividend requires high-value domestic R&D, structural tax rationalization, and modernized human capital systems.
Data Sources & Attribution
-
Demographic Extrapolations: Baseline projections derived from Census of India 2011 demographic growth models (extrapolated to 2025–2026).
-
Economic & Fiscal Data: Reserve Bank of India (RBI) Bulletins, Ministry of Finance Economic Surveys (2024–2026), and National Statistical Office (NSO) releases.
-
Global Benchmarking: World Bank Open Data, International Monetary Fund (IMF) World Economic Outlook, and OECD Statistical Database.
Disclaimer: This report is for informational and analytical purposes only and does not constitute formal financial, investment, or policy advice.