The Anatomy of a Hemorrhaging Empire: Unmasking the $1.5 Trillion Human and Fiscal Reckoning Behind 76,516 American Overdose Fatalities
NEW DELHI, India (October 30, 2026 / IST) — If you still believe gross domestic product measures national strength, you are looking at the wrong ledger. The world’s richest consumer market just logged 76,516 preventable deaths across its homeland in a single calendar cycle. While Wall Street celebrates marginal quarterly dips and headline indices, a silent civil war waged by synthetic chemical distribution continues to hollow out America’s prime-age labor supply.
Behind every bureaucrat’s spreadsheet lies a stark human reality: families fractured, corporate workforces depleted, and state treasuries draining billions into reactive emergency interventions.
The illusion of a self-correcting economy breaks the moment you study the raw distribution of these casualties. We are observing the physical erosion of human capital across the world’s reserve-currency superpower.
When prime-age adults exit the productive equation in body bags, the macro-financial implications tear through corporate balance sheets, state pension reserves, and sovereign risk calculations.
The Geography of Despair: Where Continental Wealth Collapses Into Chemical Graves
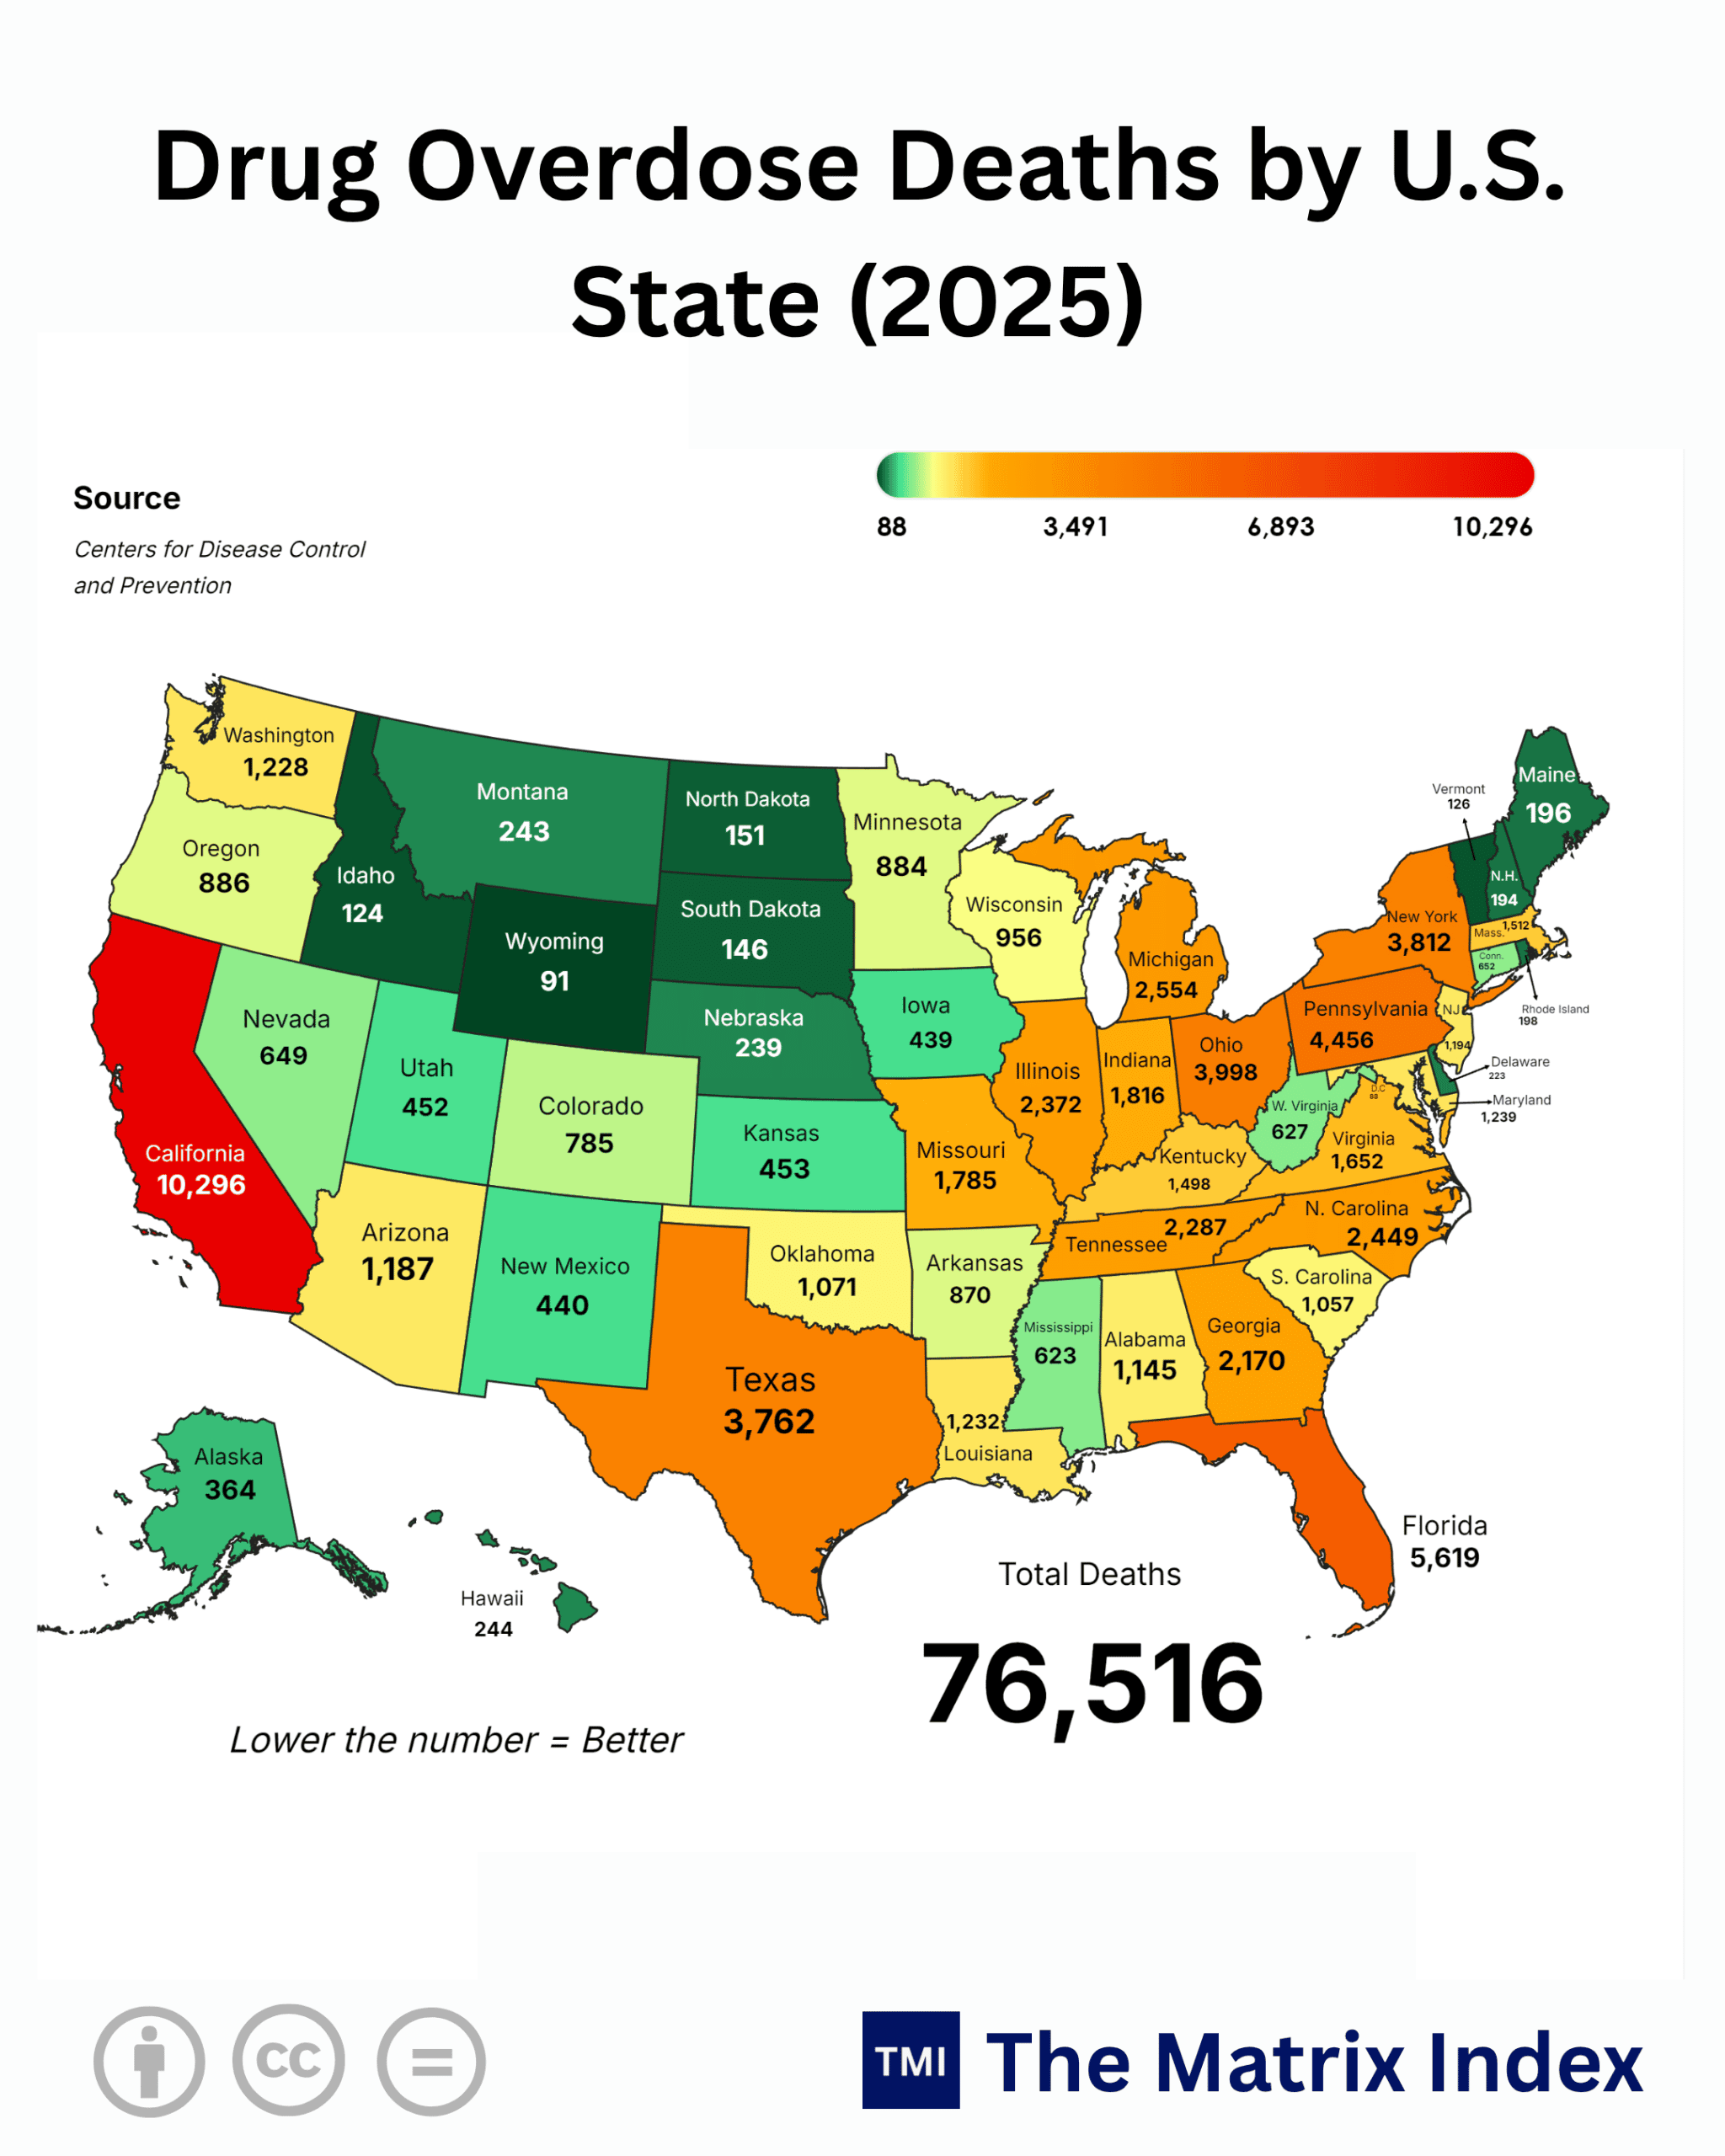
Examine the epicenter of this collapse. California leads the tally with 10,296 corpses, representing an astonishing 13.46% of all national overdose mortalities. Consider the irony: the undisputed capital of global artificial intelligence and high-margin software innovation cannot stop its own workforce from self-annihilating on street corners and suburban bedrooms.
Florida follows with 5,619 fatalities, cementing the Sunbelt’s status as a corridor of profound social dislocation. Further north, the legacy manufacturing core remains trapped in an unbroken cycle of despair: Pennsylvania logged 4,456 deaths, while Ohio registered 3,998. Even New York recorded 3,812 fatalities, and Texas saw 3,762 lives extinguished.
Together, these six jurisdictions account for 31,943 deaths more than 41.7% of the entire domestic total.
This is not a regional aberration; it is a structural implosion. The geographic breadth spans from Michigan (2,554 deaths) and North Carolina (2,449 deaths) to Illinois (2,372 deaths) and Tennessee (2,287 deaths).
The crisis defies simplistic partisan or demographic stereotypes. It cuts across high-tax urban jurisdictions and low-tax deregulation havens with ruthless indifference.
Forensic Ledger: Comprehensive 50-State Overdose Mortality Audit
The complete official record of state-level drug overdose fatalities reveals the national scale of this crisis.
(The Bitter Truth): Even after billions in federal harm-reduction spending, 76,516 fatalities per year means an American citizen is chemically wiped out every 6.8 minutes. This loss drains an estimated $1.5 Trillion annually in aggregate economic capacity, foregone tax revenues, foster care caseloads, and emergency room write-offs.
Global Benchmarks: The Structural Disconnect Across Developed Economies
To understand the magnitude of 76,516 deaths, compare it against global standards.
In Japan, nationwide drug overdose deaths rarely breach 300 annually, supported by intense community cohesion, strict supply interdiction, and proactive universal healthcare.
Germany, the manufacturing heart of Europe, registers approximately 2,000 drug-induced deaths per year despite housing over 84 Million citizens. Their secret lies in harm reduction, supervised consumption clinics, and extensive social safety nets.
Now evaluate the United Kingdom and Australia.
The UK faces acute opioid complications, yet logs roughly 4,500 to 5,000 annual misuse deaths across England, Wales, and Scotland combined.
Australia records around 2,000 substance deaths per annum, keeping mortality rates well below one-third of the American metric through community-based diversion frameworks.
The divergence is stark: Tier-1 peers treat substance dependency as a chronic health disorder, while the American system treats it as an uncoordinated battleground between private insurance networks, overextended law enforcement, and for-profit healthcare monopolies.
The “So What?” Factor: Why These Fatalities Shatter the Real Economy
Wall Street fund managers sitting in Manhattan penthouses rarely track overdose maps. That oversight is costly. The death of 76,516 citizens predominantly working-age men and women between 20 and 54 creates compounding economic shocks across three primary sectors:
1. The Labor Supply Hemorrhage and Productivity Drain
When a worker dies at 34, the economy loses three decades of active output, income tax yield, and skilled labor.
Federal Reserve district surveys frequently flag chronic labor shortages in blue-collar sectors like trucking, advanced welding, construction, and high-precision machining. These are the exact cohorts most exposed to industrial injury, subsequent opioid prescriptions, and downstream street-level fentanyl exposure.
The result is structural wage-push inflation: companies pay escalating premiums for scarce, clean labor while aggregate productivity drops.
2. The Commercial Real Estate and Municipal Bond Spiral
Examine California’s count of 10,296 or Pennsylvania’s 4,456. High overdose rates coincide directly with the collapse of urban retail centers. Foot traffic evaporates in commercial downtown districts plagued by public encampments and open-air drug markets.
Commercial real estate values plunge, eroding municipal property tax bases.
City councils then raise property taxes on surviving small businesses or cut back municipal services, triggering capital flight to lower-density suburbs and leaving city balance sheets hollowed out.
3. Corporate Health Insurance Premiums and Uncompensated Hospital Debt
Every fatal overdose involves an average of 3 to 7 prior emergency room admissions, ambulance dispatches, toxicology tests, and intensive care stays.
Private and public hospitals absorb these unpaid costs as bad debt, which they shift directly onto corporate employer health plans.
If your company’s healthcare insurance premiums climbed 8% to 12% this fiscal year, you are directly paying the hidden surcharge of this public health crisis.
Seasonality & Anomaly Alert: Genuine Shift or Short-Term Valley?
Is the decline from the 2022–2023 peak of 110,000+ annual deaths to 76,516 a systemic policy victory? Do not celebrate prematurely.
Public health officials credit widespread distribution of over-the-counter Naloxone (Narcan), combined with targeted interdiction of key synthetic precursor shipments from overseas.
These interventions save lives in the immediate moments of respiratory failure. However, they treat the symptom, not the underlying cause.
A temporary drop in deaths does not mean a drop in active addiction.
If millions remain dependent on illicit synthetic chemicals while surviving overdoses due to nasal sprays, the population remains medically fragile, economically inactive, and vulnerable to deadlier street compounds like xylazine (tranq) or ultra-potent nitazenes.
Any supply-chain shock or temporary lapse in municipal harm-reduction funding could cause these figures to rebound rapidly.
Strategic Blueprint: The Dual-Track Trajectory (2026–2030)
To forecast the trajectory of this crisis, we must weigh two distinct economic paths.
Bull Case: Re-Industrialization, Biosensors, and Active Intervention
-
Targeted Capital Deployment: The $50+ Billion collected from national opioid lawsuits shifts entirely into long-term mental health infrastructure and vocational retraining, moving away from short-term municipal budget patches.
-
Continuous Biomarker Surveillance: Wearable continuous biosensors and expanded access to monthly long-acting buprenorphine depot injections slash fatal overdoses below 40,000 annually by 2030.
-
Workforce Reintegration: Aggressive federal tax credits incentivize manufacturing, tech, and building trades to hire recovering citizens, restoring over 1.2 Million sidelined workers into the formal economy.
-
Border Precursor Interdiction: Advanced spectroscopic cargo screening chokes off the transit of synthetic precursors, raising the cost of illicit manufacturing and driving up street prices until demand falls.
Bear Case: Synthetic Saturation, Rural Collapse, and Fiscal Exhaustion
-
Next-Generation Synthetic Proliferation: Cartels replace standard fentanyl with ultra-potent synthetic nitazene analogs that resist standard naloxone dosages, pushing annual fatalities back above 100,000 by 2028.
-
Local Safety Net Insolvency: State Medicaid systems buckle under escalating chronic-care and organ-damage treatment costs from polysubstance abuse, prompting cuts to fundamental healthcare access.
-
The “Depopulation Trap”: Rust Belt and Appalachian manufacturing counties lose an entire generation of prime-age parents, straining regional foster systems and gutting local school enrollments.
-
Corporate Disinvestment: Multinational enterprises abandon regions with high substance abuse, deepening capital flight and locking local populations into permanent economic stagnation.
The Alternate Scenario: The Supply-Side Reshuffle
What happens if international synthetic drug trade routes are permanently disrupted?
If authorities cut off the supply of chemical precursors, cartels will not simply fold their operations. Illicit drug syndicates operate as ruthless, market-driven entities focused on maximizing capital returns.
A sudden drop in street supply would cause black-market prices to spike, driving up property crime, burglaries, and retail theft as individuals struggle to finance their dependencies.
Simultaneously, domestic criminal networks would pivot toward synthetic stimulants like methamphetamine or unregulated lab-made intoxicants, shifting emergency room burdens from respiratory failure to acute psychiatric crises and cardiovascular collapse.
Without accessible detoxification and long-term recovery facilities, cutting supply simply shifts the crisis from one clinical pathology to another.
Cross-Jurisdictional Vulnerability Assessment
The operational divide between proactive and reactive management states illustrates the path forward.
(The Golden Opportunity): States that shift from punitive criminalization to integrated labor-recovery ecosystems can reclaim up to 1.5% of gross state product in restored productivity. They will lower incarceration costs and turn broken lives into productive, tax-paying assets.
Global Spillover: What the American Crisis Signals for India’s 2047 Vision
For policy leaders in New Delhi and international corporate boardrooms, this American tragedy serves as an urgent cautionary tale.
India cannot afford to celebrate its demographic dividend without building defenses against synthetic chemical hazards.
As India progresses along its Viksit Bharat 2047 roadmap scaling manufacturing from 17% to 25% of GDP and urbanization toward 50% it must study the systemic vulnerabilities of the Western model:
-
Protect the Industrial Workforce: As millions migrate into concentrated industrial corridors, workplace mental health, physical safety, and ethical pain-management protocols must be integrated into primary healthcare systems.
-
Preserve Social Infrastructure: The primary buffer protecting emerging Asian economies from widespread addiction crises is the traditional family and community support network. If westernized hyper-individualism erodes these safety nets without adequate public alternatives, synthetic alternatives will fill the void.
Verdict: The Cost of Inaction
The tally of 76,516 deaths in 2025 is not just an emotional tragedy; it is an economic warning.
A nation cannot lead in artificial intelligence, aerospace, and geopolitical trade while losing thousands of its prime-age citizens each month to preventable chemical poisoning.
Relying on nasal naloxone to pull workers back from the brink of death is not a sustainable public health policy. It is a temporary patch on a ruptured hull.
True resilience demands radical systemic reform: holding corporate bad actors fully accountable, overhauling behavioral healthcare infrastructure, and treating the domestic workforce as a vital asset rather than an expendable input.
If the world’s most powerful economic engine refuses to confront this human crisis, the rot will spread down from its social foundation directly into its sovereign balance sheet.
The numbers are written in black and white. How will leadership respond?
-
For Institutional Investors: Audit your domestic supply chains. Screen corporate holdings for workforce health resilience, assess municipal bond portfolios for real estate risks in heavily impacted counties, and reallocate capital toward modern mental health infrastructure.
-
For Policymakers and Corporate Leaders: End the cycle of denial. Treat human capital preservation as the bedrock of your macroeconomic and operational survival.
GOOGLE ‘PEOPLE ALSO ASK’ FAQs
Q1: How many total drug overdose deaths occurred in the United States in 2025?
A: 76,516 total preventable fatalities occurred nationwide, wiping out an American citizen every 6.8 minutes. This labor deficit siphons roughly $1.5 Trillion annually in aggregate productivity, uncompensated emergency care, and diminished tax bases.
Q2: Which US states suffered the highest overdose fatalities in 2025?
A: 10,296 deaths occurred in California alone, followed by Florida with 5,619, Pennsylvania with 4,456, and Ohio with 3,998. Together with New York and Texas, these six states comprise 41.7% of all national casualties.
Q3: How does the US overdose mortality rate compare globally to peer nations?
A: 22.4 deaths per 100,000 citizens makes the US mortality rate nearly ten times higher than Germany’s 2.3 per 100,000. Japan maintains fewer than 300 annual casualties, averaging just 0.2 per 100,000 through universal healthcare and strict interdiction.
Q4: What is the economic cost of the US overdose crisis on industries?
A: $1.5 Trillion in yearly economic capacity is erased as prime-age industrial workers between ages 20 and 54 vanish from the labor force. Surviving employers face 8% to 12% spikes in corporate health premiums to absorb uncompensated emergency room debts.
Q5: What are the economic forecasts for US overdose mortality through 2030?
A: 40,000 annual deaths represent the best-case 2030 milestone if $50+ Billion in settlement funds build permanent treatment infrastructure. Conversely, emerging synthetic nitazenes could push annual fatalities back past 100,000 by 2028 if precursor controls collapse.
Data Source:
- Centers for Disease Control and Prevention (CDC)
- National Center for Health Statistics (NCHS)
- National Vital Statistics System (NVSS)
- U.S. Bureau of Economic Analysis (BEA)
- U.S. Federal Reserve Economic Data (FRED).
Disclaimer: This report is for informational and analytical purposes only and does not constitute formal financial, investment, or policy advice.