The Faith Paradox: Capital Allocation, Labor Productivity, and the Secularization Divide Across the American Continental Economy
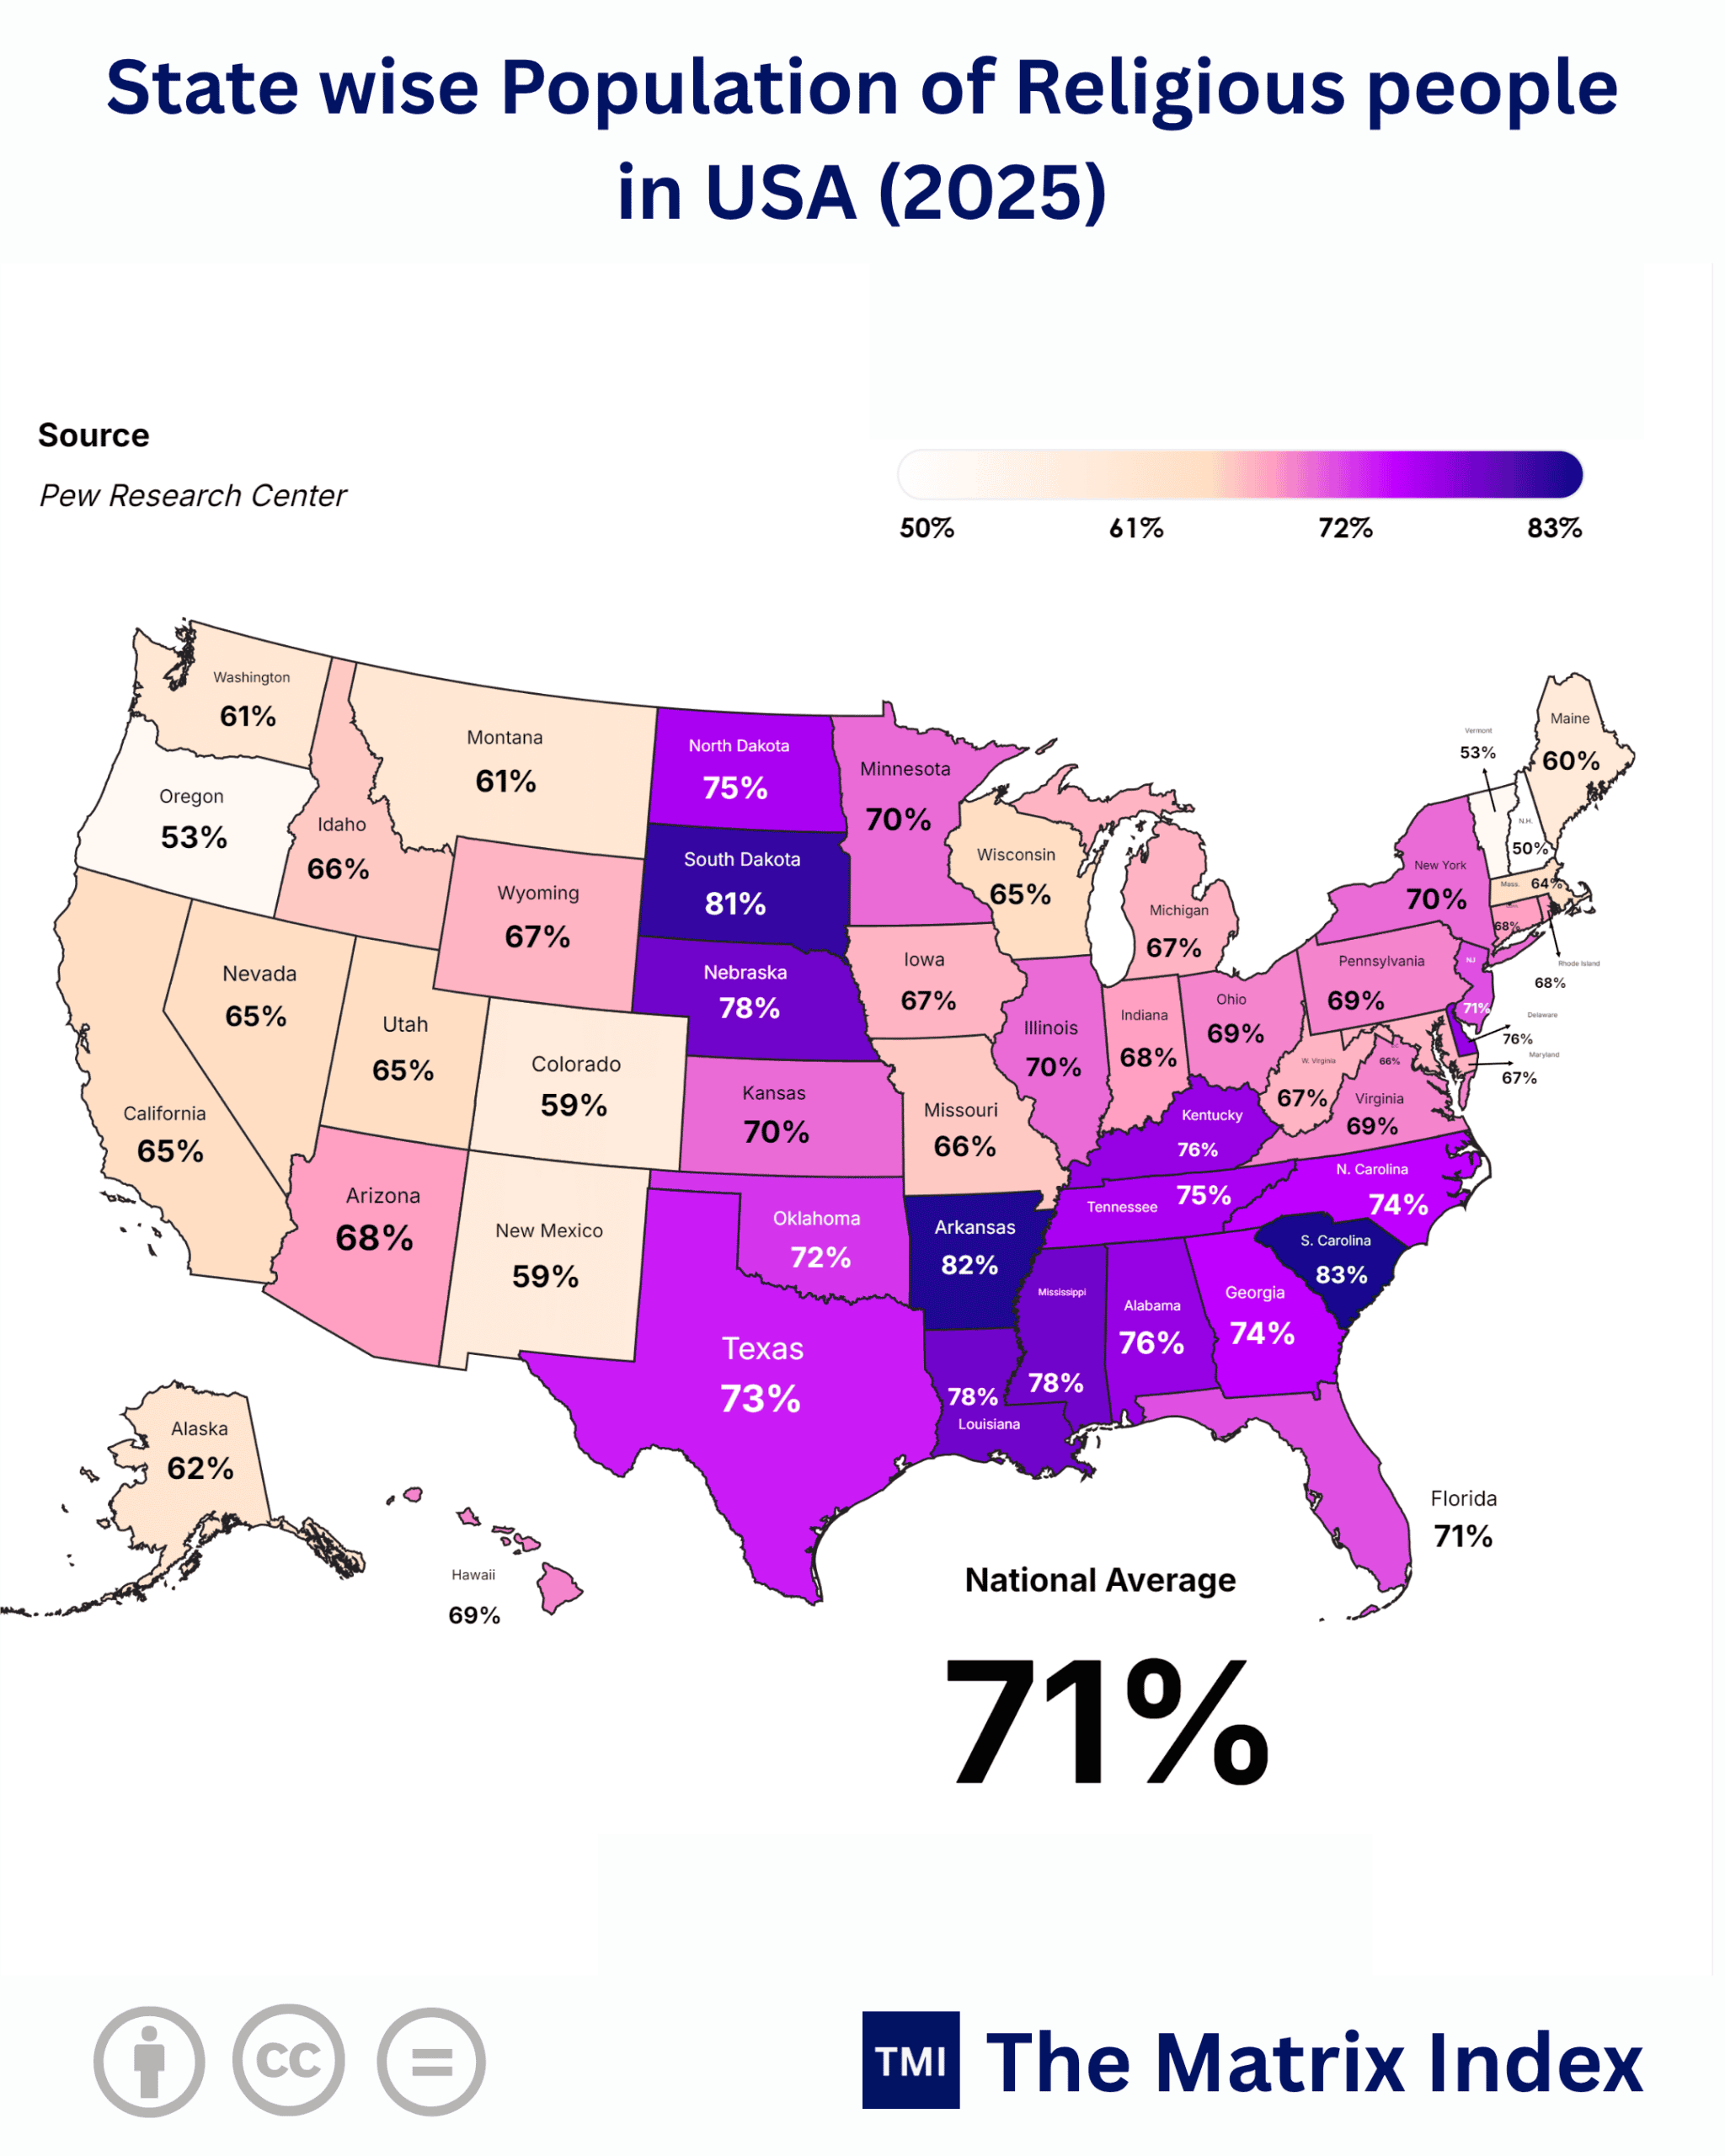
| State | Population of Religious People (%) |
|---|---|
| South Carolina |
83% |
| Arkansas |
82% |
| South Dakota |
81% |
| Nebraska |
78% |
| Mississippi |
78% |
| Louisiana |
78% |
| North Dakota |
75% |
| Tennessee |
75% |
| Minnesota |
70% |
| Illinois |
70% |
| Kansas |
70% |
| New York |
70% |
| Virginia |
69% |
| Ohio |
69% |
| Pennsylvania |
69% |
| Hawaii |
69% |
| North Carolina |
74% |
| Georgia |
74% |
| Texas |
73% |
| Oklahoma |
72% |
| Florida |
71% |
| Connecticut |
71% |
| Kentucky |
76% |
| Alabama |
76% |
| Delaware |
76% |
| Idaho |
66% |
| Missouri |
66% |
| Maryland |
67% |
| Iowa |
67% |
| Michigan |
67% |
| Wyoming |
67% |
| Indiana |
68% |
| Arizona |
68% |
| New Jersey |
68% |
| Nevada |
65% |
| Utah |
65% |
| Wisconsin |
65% |
| California |
65% |
| Rhode Island |
64% |
| Alaska |
62% |
| Washington |
61% |
| Montana |
61% |
| Maine |
60% |
| Colorado |
59% |
| New Mexico |
59% |
| Massachusetts |
53% |
| Oregon |
53% |
| Vermont |
53% |
| New Hampshire |
50% |
| National Average |
71% |
NEW DELHI, India (October 14, 2026 / IST) — Strip away the sanctimony and the pious press releases: religion has never been merely about personal salvation, but rather the single most durable, unhedged financial derivative ever devised by human civilization. When a nation’s spiritual demographic shifts, its entire capital expenditure engine, tax base, and risk appetite follow suit. Look closely at the baseline numbers across the United States. While Washington’s national headline figures project a seemingly steady 71% national religious adherence, that aggregated figure is an outright statistical mirage masking a deep, structural bifurcation.
We are witnessing an unprecedented economic divergence between states anchored in deep devotional identity and those rapidly decoupling toward secularization. The gap between South Carolina (83%) and New Hampshire (50%) is not a harmless cultural disagreement about Sunday routines. It represents a fundamental difference in capital efficiency, public debt sustainability, domestic migration velocity, and human capital formation.
Economists who treat religiosity as mere demographic trivia are committing malpractice. If you run a multi-billion dollar hedge fund, manage cross-border venture capital, or formulate sovereign industrial policy from New Delhi, London, or Tokyo, ignoring this friction will cost you. Culture dictates the velocity of money.
Let us dissect the anatomy of this divide without gloves.
The Macroeconomic Baseline: Mapping America’s Spiritual and Financial Fault Lines
The conventional narrative pushed by mainstream Western outlets suggests secularization spreads evenly across all post-industrial democracies. The actual data reveals this assumption to be flatly incorrect. America is not secularizing homogenously; it is polarizing geographically and socioeconomically.
The dataset breaks down into distinct territorial clusters with diametrically opposed economic characteristics:
This distribution establishes a steep 33 percentage-point spread inside a single currency union operating under one central bank, the Federal Reserve. For global macro allocators, such a spread produces internal imbalances comparable to the structural tensions observed within the Eurozone between peripheral southern states and fiscal northern sovereigns.
The Master Ledger: State Adherence and the Secularization Gradient
To understand how money moves through these jurisdictions, we must look at the comprehensive state breakdown relative to the 71% National Average.
The Bitter Truth: The states posting the highest religious adherence figures—such as Mississippi (78%), Arkansas (82%), and Louisiana (78%)—remain structural net recipients of the federal balance of payments. They rely heavily on the taxable wealth generated by secularizing, highly transactional economic engines like Massachusetts (53%) and Washington (61%) to finance their basic annual budgetary shortfalls.
Global Parallels: How the US Divide Mirrors the International Economic Order
To grasp the commercial consequences of this internal American rift, we must examine international precedents. The economic trajectory of nations has repeatedly been steered by the retreat or entrenchment of religious institutions.
In Tier-1 economies like Germany and Japan, secularization went hand in hand with precision engineering, hyper-specialized manufacturing, and comprehensive state-managed social safety nets. However, it also ushered in an acute demographic winter. In Germany, church tax registrations (Kirchensteuer) have plummeted over the past two decades, matching a collapse in domestic birth rates that now threatens its mid-market Mittelstand industrial foundation.
Conversely, looking at dynamic Tier-2 powers like India, religious networks operate as vast, parallel economic support systems. Family units, local business cartels, and community endowments underwrite micro-lending, personal disaster relief, and trade credit lines without leaning on state apparatuses.
The United States attempts to run both models simultaneously inside a single institutional framework:
-
The Northern European Post-Industrial Model: Observed in states like Vermont (53%) and New Hampshire (50%), where church attendance is negligible, personal autonomy is prioritized, tax rates are heavily scrutinized, and the demographic pyramid is rapidly inverting.
-
The High-Cohesion Emerging Market Model: Observed in places like South Carolina (83%) and Texas (73%), where church networks function as unofficial chambers of commerce, childbearing rates remain resilient, and informal community capital fills the gaps left by minimal state welfare budgets.
This structural inconsistency inside America creates intense frictions in federal spending, reproductive policy, labor mobility, and education funding.
The “So What?” Factor: Why Spiritual Metrics Dictate Cash Flows
Why should an institutional investor or corporate treasurer care about an 80% versus a 50% religious adherence footprint? Because these figures directly alter the following balance sheets:
1. Municipal Bond Ratings and Unfunded Liabilities
In highly religious states, social security nets are heavily outsourced to private, faith-based charities, churches, and extended family networks. This enables state governments in places like Tennessee (75%) and Florida (71%) to run lean administrative budgets, avoid expansive welfare systems, and reject state personal income taxes.
However, this reliance creates an overlooked fragility. When an economic recession strikes, church tithing drops instantly, often contracting by 15% to 30% within two quarters. Lacking strong municipal safety nets, local governments are forced to absorb sudden spikes in indigent healthcare and housing support, which strains county-level general obligation bonds.
2. Labor Force Participation and Female Wage Compression
Consider the deep South: Arkansas (82%) and Alabama (76%). Traditional social expectations directly suppress female labor force participation in high-margin corporate sectors, channeling talent into lower-paying care and service roles.
By contrast, in Massachusetts (53%) and Colorado (59%), dual-income households dominate the tax base, boosting median household incomes but driving up housing costs to levels that price out working-class families entirely.
3. Commercial Real Estate and Endowment Capital
Houses of worship occupy prime, non-taxable real estate. In states with high adherence like Ohio (69%) and North Carolina (74%), billions of dollars in commercial and residential acreage remain completely locked out of municipal property tax rolls.
In contrast, in secularizing territories like Oregon (53%) and Maine (60%), struggling mainline churches are rapidly offloading their properties to private developers. This wave of transactions is unlocking prime urban land for high-density residential construction, fundamentally reshaping urban tax yields.
The Deep Structural Divide: Capital Allocations Across State Archetypes
To trace these dynamics clearly, we can categorize the data into three major macroeconomic profiles:
The Traditional Sunbelt Core (73% – 83%)
States like South Carolina (83%), Arkansas (82%), and Texas (73%) are actively leveraging traditional social structures to attract industrial manufacturing, automotive assembly, and chemical infrastructure. Their pitch to multinational corporations is straightforward: low corporate taxes, weak labor unions, and a stable, compliant workforce anchored by local community institutions.
The hidden risk here is human capital quality. These states persistently underfund public education, ranking near the bottom of national benchmarks for science and mathematics literacy. They are effectively trading long-term technological adaptability for near-term labor arbitrage.
By relying on informal church safety nets rather than investing in public technical infrastructure, they risk hitting an economic ceiling as manufacturing becomes increasingly automated.
The Industrial & Rust Belt Transition Zone (66% – 70%)
In Michigan (67%), Pennsylvania (69%), and Illinois (70%), the story is one of institutional decay. These states were originally built on two pillars: industrial labor unions and tight-knit neighborhood parishes.
Today, both pillars are eroding. As traditional manufacturing jobs automated or moved south, the parish communities that once distributed credit, provided childcare, and maintained community wealth collapsed along with them.
The economic fallout is evident in balance sheets across the region. Cities like Chicago, Cleveland, and Detroit face compounding crises: massive unfunded municipal pensions coupled with sprawling, tax-exempt church real estate that can neither be taxed nor easily repurposed. The result is a persistent fiscal drag that stifles municipal turnaround efforts.
The Secular Knowledge Frontier (50% – 65%)
In New Hampshire (50%), Vermont (53%), Massachusetts (53%), and California (65%), a totally different set of economic incentives is at work. Secularization here has aligned with aggressive individual wealth accumulation, high rates of advanced degree attainment, and surging venture capital investment.
Yet this economic dynamic carries its own severe vulnerabilities:
-
Demographic Stagnation: Birth rates in these states have dropped far below the 2.1 replacement rate, hovering around 1.4 to 1.6.
-
Talent Replacement Costs: To sustain their economies, these states must continually import skilled labor from elsewhere in the country and across the world, bidding up local wages.
-
Cost-of-Living Explosions: The collapse of traditional, community-based support networks has financialized daily life. Childcare, elder care, and mental healthcare are now purchased as expensive private services rather than managed through extended families or community groups, driving up basic living costs.
Seasonality, Anomaly Alert, and Demographic Distortion
A superficial reading of this data might suggest that state-level religiosity is fixed. That is a mistake. What appears to be stable demographic adherence is being actively warped by two powerful short-term distortions:
1. The Post-2020 Sunbelt Migration
The mass relocation of white-collar workers from high-tax, secular states like California (65%) and New York (70%) into Texas (73%), Florida (71%), and North Carolina (74%) is introducing a quiet cultural shock.
These incoming professionals bring substantial purchasing power, but they do not attend local churches or participate in traditional community networks. This migration is inflating local housing prices while remaining culturally unintegrated, steadily eroding the traditional social ties that these states’ low-tax models depend on.
2. The Hispanic Demographic Buffer
States like Texas (73%), Arizona (68%), and California (65%) would show much faster drops in religious adherence were it not for steady Catholic immigration from Latin America.
First-generation immigrant families report religious adherence rates well over 80%. However, longitudinal tracking shows this buffer is temporary. Second- and third-generation Hispanic Americans secularize at nearly the same rate as the broader population.
What looks like stable long-term adherence is actually an import of demographic momentum that will likely wash out over the next ten to fifteen years.
Strategic Scenarios: Mapping the Next Decade
To make this analysis actionable for corporate strategists, hedge fund risk officers, and policy analysts, we must project how these dynamics will interact with broader economic forces.
The Bull Case: Sunbelt Convergence & Institutional Synthesis
In this scenario, high-adherence Sunbelt states leverage their lower operating costs and stable birth rates to establish a durable competitive advantage over secular northern states:
-
Sustainable Replacement Rates: Maintaining fertility rates near replacement levels shields states like Texas (73%) and Georgia (74%) from the severe labor shortages hitting the Northeast.
-
Modernized Community Infrastructure: Mega-churches and associated charitable networks evolve into sophisticated, cost-effective service providers, offering low-cost daycare, vocational training, and elder support. This allows state governments to keep corporate and personal income taxes near zero.
-
Capital Retention: Global manufacturing hubs steadily shift capacity toward these markets, pulling institutional capital away from high-regulation, secularized jurisdictions.
The Bear Case: Balkanized Capital Flight & Institutional Collapse
In this scenario, cultural and demographic tensions trigger compounding economic headaches:
-
Talent Flight: Aggressive social and cultural legislation enacted by conservative religious legislatures alienates high-value technology and life-sciences talent. Corporations struggle to recruit skilled workers to regional hubs in places like Arkansas (82%) or South Carolina (83%).
-
Safety Net Failures: As younger residents pull away from organized religion, church tithing revenues fall sharply. Without church-funded support systems, rural healthcare and basic social services buckle, forcing state governments to either hike taxes or allow local infrastructure to decay.
-
Northern Stagnation: Simultaneously, secular northern states like Massachusetts (53%) and Vermont (53%) hit a demographic brick wall. Aging populations, shrinking workforces, and escalating legacy pension obligations consume state revenues, leaving little room for public investment.
Alternative Counter-Narrative: The Tech-Enclave Fracture
What happens if conventional political boundaries stop mattering to capital flows?
Consider the rise of self-contained, high-tech corporate enclaves. As artificial intelligence infrastructure, private energy grids, and specialized manufacturing facilities expand across states like Ohio (69%), Tennessee (75%), and Texas (73%), global tech giants are increasingly constructing their own parallel social infrastructure.
When a multi-trillion-dollar conglomerate builds an advanced industrial campus, it does not rely on local community safety nets or rural hospitals. It builds its own healthcare centers, negotiates dedicated private utility feeds, and provides proprietary, on-site childcare.
If this model spreads, the cultural and religious differences of surrounding local communities become economically irrelevant to the corporate bottom line. States could find themselves split into high-productivity, hyper-secular corporate compounds surrounded by economically struggling, traditionally religious hinterlands—creating a dual economy that operating metrics fail to capture.
The Strategic Balance Sheet: Capital Allocations and Economic Realities
The Golden Opportunity: Savvy institutional investors can exploit this arbitrage. By financing private-public educational partnerships, technical training centers, and regional healthcare systems in high-adherence, low-tax Sunbelt states, capital allocators can capture low-cost operations while actively fixing the talent bottlenecks holding these regions back.
Global Strategic Implications for India’s Long-Term Horizons
For Indian economic planners mapping the path toward Vision 2030 and the developed-nation milestones of Viksit Bharat 2047, the lessons from America’s cultural and economic divide are direct and urgent.
India’s greatest long-term macro asset is not its raw population size; it is social resilience. In India, as in parts of the American Sunbelt, informal social safety nets—family businesses, community mutual funds, and local religious trusts—underwrite economic security for hundreds of millions of people without loading the sovereign balance sheet with unpayable welfare debt.
However, the cautionary tale from states like Mississippi (78%) and South Carolina (83%) is impossible to ignore. Social cohesion without modern, state-backed investments in technical education, hard infrastructure, and healthcare leads to an economic dead end. Relying solely on tradition while shortchanging modern scientific, mathematical, and industrial training traps a workforce in low-value assembly work, vulnerable to the first wave of automation.
If India is to hit its target of a $30-trillion economy by 2047, it must chart a balanced path:
-
Protect Community Social Capital: Avoid building a sprawling, debt-funded welfare state that erodes the family support systems that keep national savings rates high.
-
Aggressively Fund Public Technical Infrastructure: Invest state resources into high-end manufacturing, semiconductors, advanced materials, and STEM education to avoid the productivity ceilings holding back the American Deep South.
-
Formalize Community Wealth: Encourage traditional community institutions, endowments, and trust networks to allocate a portion of their assets into productive domestic venture capital, advanced research, and regional infrastructure bonds.
The data from the American landscape proves that a society’s belief systems are never economically neutral. They determine where people choose to live, how much risk they are willing to take, how they allocate their savings, and what debts they pass on to the next generation. Treat these numbers as essential economic indicators, or find yourself running blind on the global chessboard.
GOOGLE ‘PEOPLE ALSO ASK’ FAQs
Q1: How does state religious adherence impact local economic growth?
A: A 33% adherence gap directly shifts social safety net costs from state balance sheets to private charities. While this allows Sunbelt states to maintain lower taxes, it systematically caps technical wage expansion and suppresses public education capital.
Q2: Which US states have the highest and lowest religious adherence?
A: South Carolina leads the nation at 83% religious adherence, closely followed by Arkansas at 82% and South Dakota at 81%. Conversely, New Hampshire records the lowest rate at 50%, with Massachusetts, Vermont, and Oregon trailing at 53%.
Q3: Why are highly religious states facing severe fiscal risks?
A: A sudden economic contraction triggers a 15% to 30% collapse in church tithing within two quarters. Without expansive municipal welfare programs, local governments face abrupt surges in emergency healthcare obligations that strain municipal bond ratings.
Q4: How does the secularization divide influence female workforce participation?
A: States with over 75% adherence show persistent female wage compression due to traditional domestic norms limiting executive corporate roles. Conversely, secular regions with sub-60% adherence rely heavily on dual-income households, which drives up median income alongside extreme housing costs.
Q5: What lessons does America’s religious-economic divergence offer India by 2047?
A: India’s roadmap toward a $30-trillion economy by 2047 requires safeguarding family and community credit networks to contain sovereign debt. However, India must simultaneously fund state-level STEM infrastructure to avoid the automated labor traps currently paralyzing the American Deep South.
Data Source:
- Pew Research Center
- US Bureau of Economic Analysis (BEA)
- US Census Bureau.
Disclaimer: This report is for informational and analytical purposes only and does not constitute formal financial, investment, or policy advice.