The $70,000 Fault Line: Deconstructing America’s Deepening Internal Economic Fracture
NEW DELHI, India (October 29, 2026 / IST) — The illusion of a monolithically wealthy United States has shattered along a stark $70,000 geographic fault line. A forensic dissection of state-level per capita output reveals that an American citizen standing in Manhattan or Seattle operates inside an economy nearly three times more productive than a worker toiling in the plains of Wyoming or the valleys of New Mexico. While Washington politicians celebrate headline national growth figures, the raw ledger exposes a republic splintering into two irreconcilable economic universes: hyper-financialized, tech-saturated metropolitan citadels on one side, and capital-starved resource peripheries on the other.
This is not a temporary statistical aberration. It is a structural crisis that threatens to rupture global currency hegemony, warp international trade routes, and offer urgent macro-economic warnings for emerging titans like India.
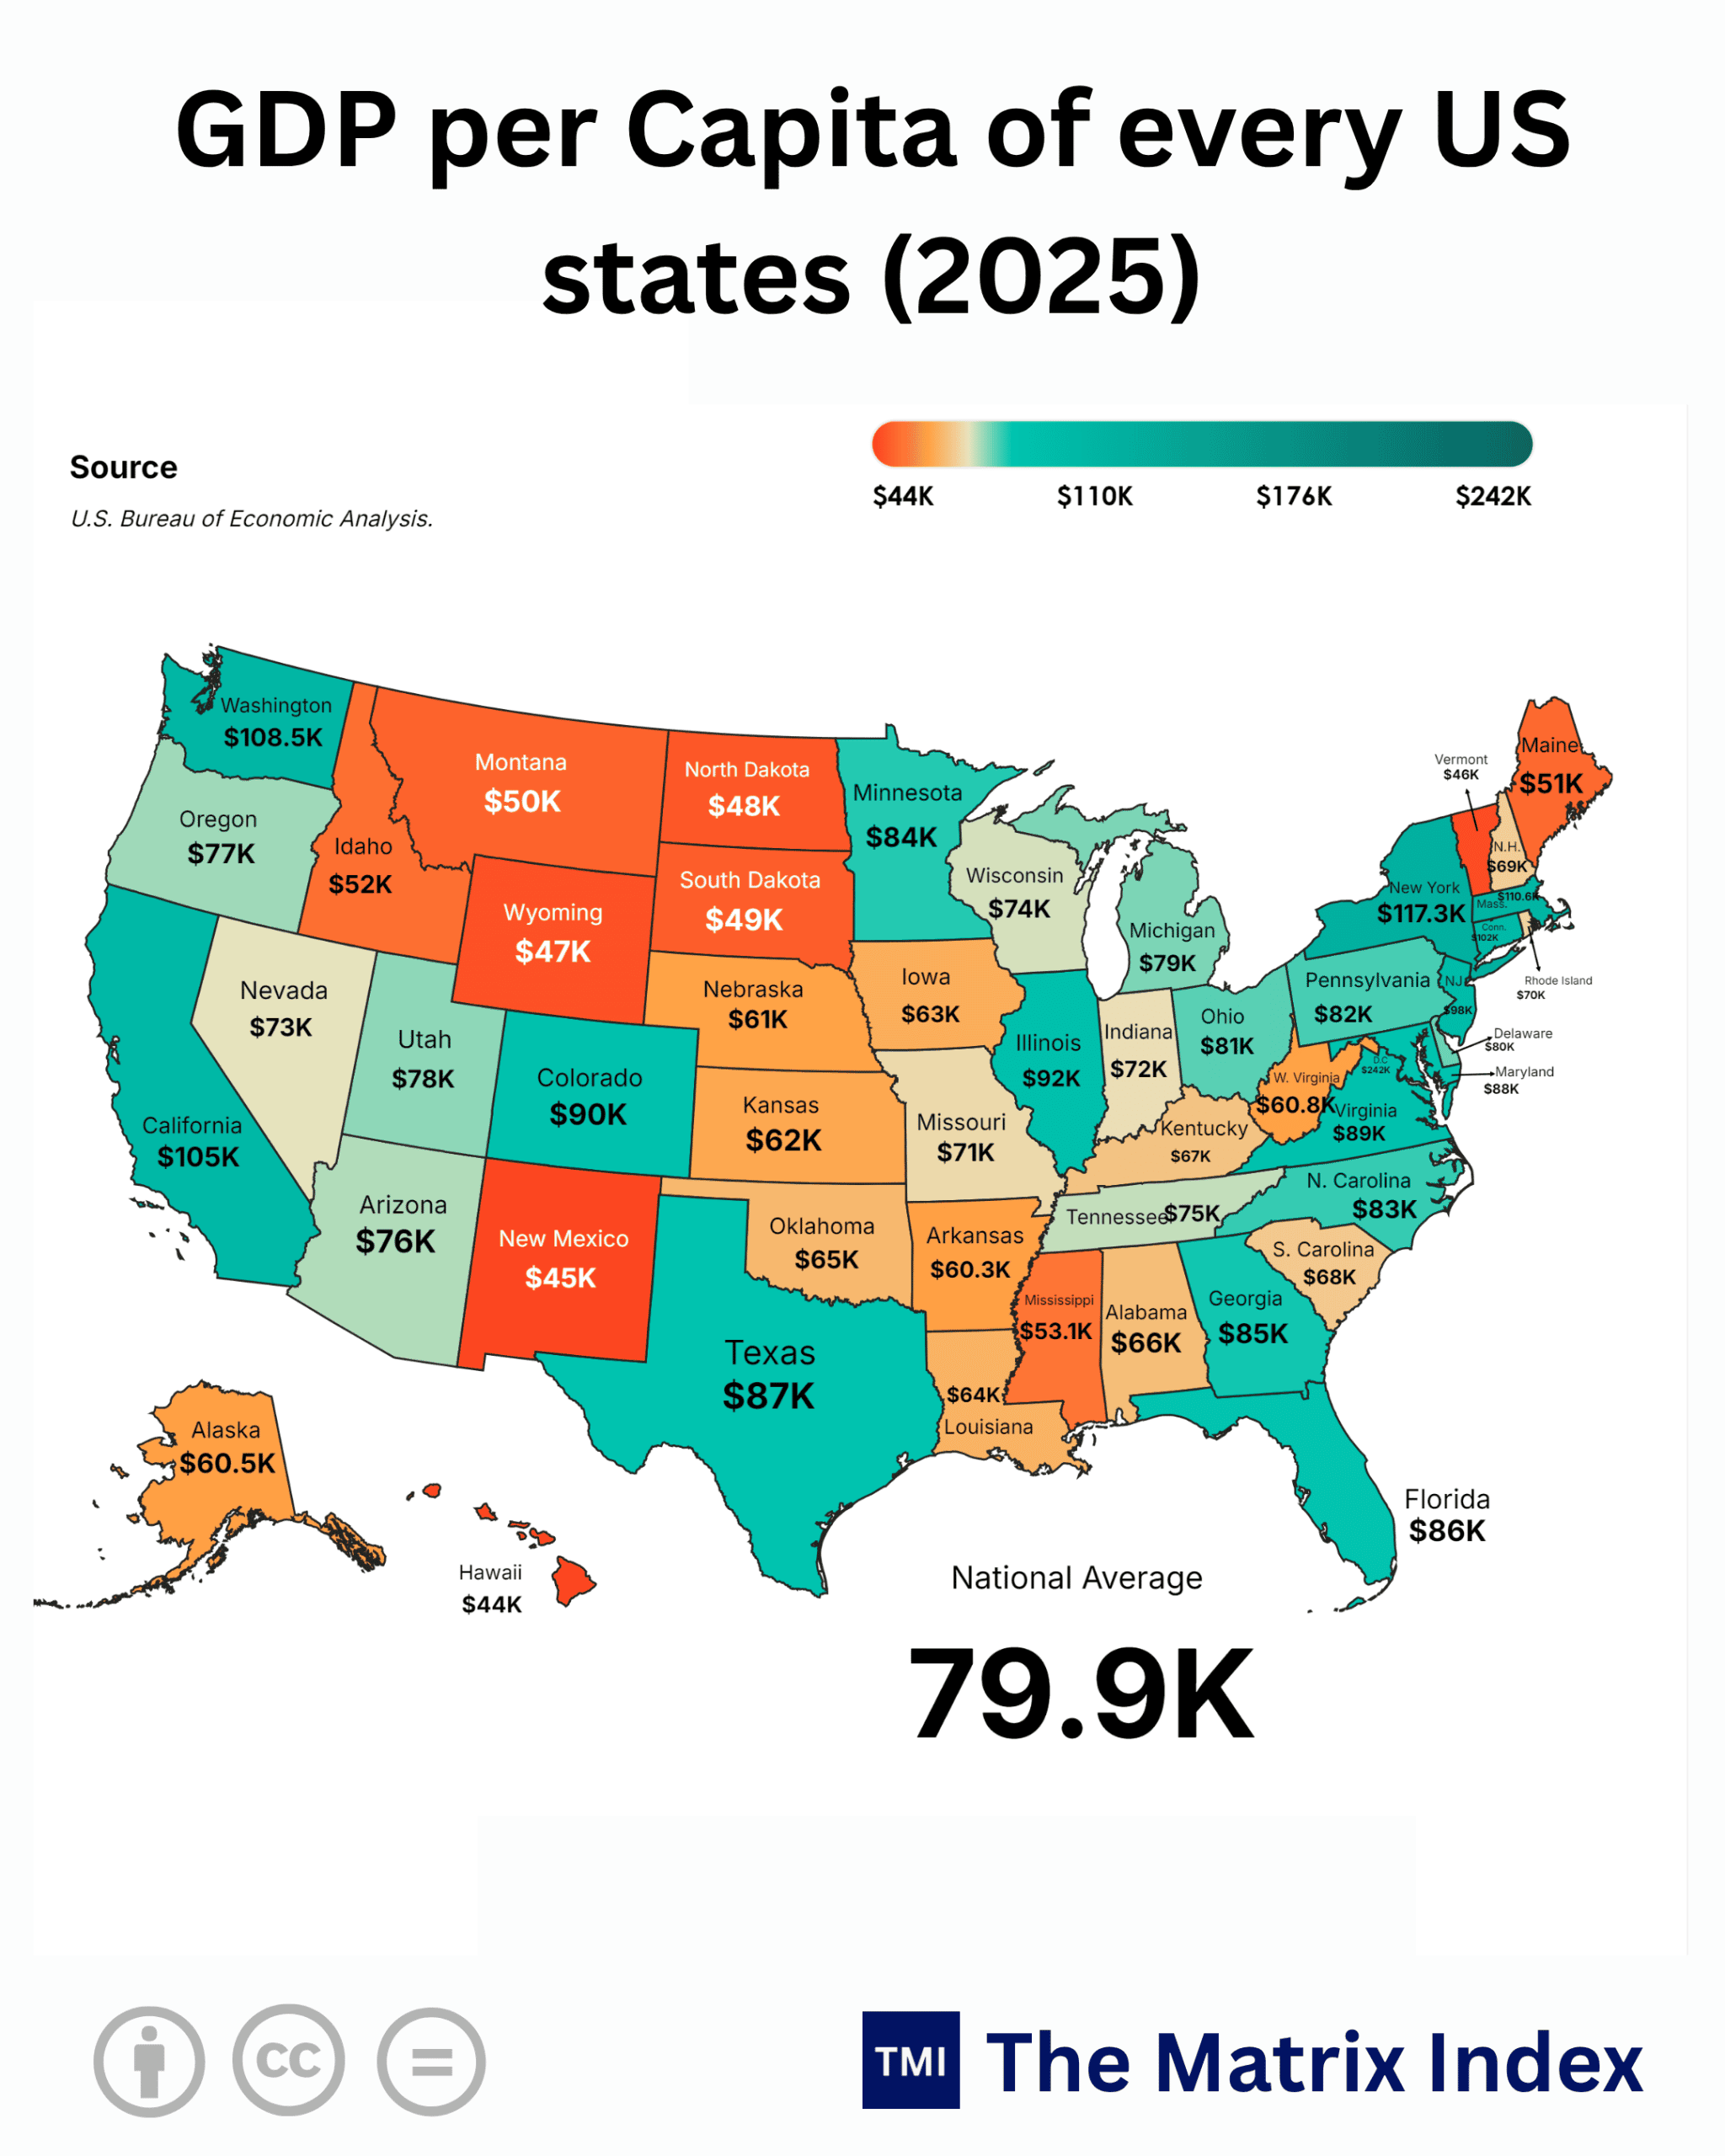
Behind the facade of the $79.9K national baseline, the gap between the apex New York at $117.3K and the nadir Hawaii at $44K and New Mexico at $45K has blown wide open. It is a chasm that modern fiscal policy can no longer paper over with debt issuance or transfer payments. When per capita economic generation diverges by 166% within the borders of a single currency union, that monetary union ceases to function as a unified economic engine.
The Anatomy of the Divergence: The Gilded Coasts vs. The Hollowed Core
Look past the curated press releases of central bankers. The numbers tell a brutally straightforward story of capital concentration. The high command of global capital allocation sits firmly in New York ($117.3K), Massachusetts ($110K), Washington ($108.5K), and California ($105K). These jurisdictions do not merely generate output; they extract rents from the entire globe.
Consider the mechanisms driving these numbers. New York’s staggering metric is not propelled by industrial plants or supply chain mastery. It is driven by algorithmic balance-sheet expansion, debt structuring, asset management fees, and institutional underwriting. The financial architecture of Wall Street captures a toll on every dollar, euro, and yen circulating through Western clearing systems.
In Washington ($108.5K) and California ($105K), intellectual property monopolies act as sovereign tax collectors over global commerce. Cloud computing, semiconductor patent licensing, enterprise enterprise platforms, and artificial intelligence architectures suck capital from European factories and Asian manufacturing hubs directly into Silicon Valley and Puget Sound balance sheets.
Now pivot to the opposite end of the spectrum. Wyoming ($47K), Vermont ($46K), New Mexico ($45K), and Hawaii ($44K) sit at the bottom of the ledger. These states resemble vulnerable developing nations far more than modern Western economies. They run single-pillar, non-scalable economies dominated by seasonal hospitality, public sector bureaucracy, or raw commodity extraction.
The middle tier spanning industrial and agricultural heartlands like Ohio ($81K), Michigan ($79K), Indiana ($72K), and Missouri ($71K) is running on an aging, depreciating base. These states are engaged in an exhausting street fight against automation, foreign supply chains, and domestic regulatory mandates. They generate goods the world actually touches and eats, yet the financial margin accrued to their laborers is systematically siphoned toward coastal equity funds.
Global Benchmarks: A Tale of Two Disconnected Hemispheres
To truly grasp the absurdity of this divergence, you must benchmark these sub-national economies against the rest of the planet. When you place American states side by side with the world’s leading Tier-1 and Tier-2 economic engines, the global imbalances come into razor-sharp focus.
The Tier-1 Comparison: USA, Germany, Japan, UK, and Australia
If New York ($117.3K) or Massachusetts ($110K) were sovereign nation-states, they would sit comfortably above Switzerland (~$98K) and blow past sovereign heavyweights. Germany’s per capita output languishes near $54K, battered by structural deindustrialization, sky-high energy tariffs, and an aging engineering apparatus. A German precision engineer in Baden-Württemberg generates less nominal dollar value per year than a mid-level marketing consultant in Seattle.
Japan (~$34K) and the United Kingdom (~$49K) look even worse in this comparison. Decades of currency suppression, stagnant productivity gains, and chronic underinvestment have reduced them to second-tier status compared to the American financial core. Meanwhile, resource-wealthy Australia (~$65K) matches up only with mid-tier American states like Oklahoma ($65K) or Louisiana ($64K).
The Tier-2 Reality: The Emerging Colossi
When measured against the Tier-2 powerhouse economies China (~$13.5K nominal), Mexico (~$14K), Brazil (~$10.5K), and South Africa (~$6.2K) the raw dollar extraction capabilities of the American coastal model appear monumental. Yet, nominal dollar per capita is a deceptive metric of real sovereign resilience.
China produces more physical industrial goods, high-speed rail networks, and green infrastructure than the entire North American continent combined. Yet, because the international financial system prices output in fiat US dollars, California ($105K) appears nearly eight times more productive on paper than the industrial powerhouse of Guangdong.
This financial alchemy represents an empire pricing its own asset claims while undervaluing the physical goods produced by the rest of the world. It is precisely this distortion that is accelerating the push toward alternative trade networks and non-dollar clearing mechanisms across the Global South.
Comparative State-Level Ledger: Output, Engines, and Global Equivalents
The following dataset maps the economic architecture across the American states for 2025-2026, identifying the operational engine of each economy, its closest sovereign nation equivalent, and its structural vulnerability.
| State / Jurisdiction | GDP Per Capita (2025) | Primary Value Driver | Comparable Sovereign Economy | Capital Vulnerability Profile |
| New York | $117.3K | Wall St Finance, PE, Corporate Legal | Switzerland / Singapore | Extreme exposure to credit liquidity shocks |
| Massachusetts | $110.0K | Biotech, Defense R&D, Venture Capital | Ireland (Multinational Hub) | Over-reliance on public research grants & VC |
| Washington | $108.5K | Cloud Infrastructure, Aerospace, Tech | Norway (Sovereign Scale) | Concentrated tech platform exposure |
| California | $105.0K | Big Tech, Entertainment, Agriculture | Denmark / Netherlands | Severe wealth disparity, corporate tax flight |
| Connecticut | $92.0K | Hedge Funds, Insurance, Wealth Mgmt | Qatar | Extreme spatial segregation of capital |
| Illinois | $92.0K | Mercantile Exchange, Transport, Food | Austria | Massive unfunded public pension liabilities |
| Colorado | $90.0K | Aerospace, Telecommunications, Software | Sweden | Housing affordability & water constraints |
| Virginia | $89.0K | Defense Contracting, Northern VA Data Hubs | Belgium | Total systemic dependence on Federal budgets |
| Maryland | $88.0K | Federal Agencies, Bio-Pharma, Cyber | Australia | Budget sequester and fiscal contraction risk |
| Texas | $87.0K | Shale Oil/Gas, Tech Relocations, Trade | Australia / Germany | Hydrocarbon volatility & power grid fragility |
| Florida | $86.0K | Wealth Migration, Real Estate, Tourism | Germany | Uninsurable coastal assets, low wage floor |
| North Carolina | $83.0K | Banking (Charlotte), Research Triangle | Canada | Mid-wage manufacturing transition stalls |
| Pennsylvania | $82.0K | Healthcare Systems, Natural Gas, Higher Ed | United Kingdom | Rust Belt demographic drag |
| Ohio | $81.0K | Heavy Machinery, Auto Supply, Logistics | United Kingdom | Structural automation of industrial jobs |
| Delaware | $80.0K | Corporate Registrations, Credit Cards | France | Global regulatory tax-haven crackdowns |
| National Average | $79.9K | National Aggregated Baseline | United States Median | Systemic Debt-to-GDP Overhang |
| Michigan | $79.0K | Automotive Manufacturing, EV Supply | France | EV market dislocation, tariff impacts |
| Tennessee | $75.0K | Auto Assembly, Music/Media, Medical Serv | Japan | Low-tax growth hitting infrastructure walls |
| Arizona | $76.0K | Semi-Foundries, Real Estate, Tourism | Japan | Catastrophic Colorado River water insecurity |
| Indiana | $72.0K | Industrial Metals, Auto Plants, Pharma | South Korea | Supply chain vulnerability to global downturns |
| Missouri | $71.0K | Agriculture, Aerospace Logistics, Finance | Italy | Slow urban core economic development |
| Kentucky | $67.0K | EV Battery Plants, Logistics, Bourbon | Spain | High chronic poverty in eastern Appalachian zones |
| Alabama | $66.0K | Aerospace (Huntsville), Auto, Timber | Spain | Deep structural gaps in educational pipeline |
| Oklahoma | $65.0K | Oil & Gas Exploration, Agriculture | Poland | Extreme sensitivity to West Texas Intermediate |
| Louisiana | $64.0K | Petrochemicals, LNG Export, River Ports | Poland | Environmental erosion, low human capital |
| Kansas | $62.0K | Grain, Aircraft Assembly, Meatpacking | Chile | Severe aquifer depletion in Western sectors |
| West Virginia | $60.8K | Metallurgical Coal, Energy, Chemical | Romania | Demographic collapse, workforce shrinkage |
| Arkansas | $60.3K | Retail Corporate HQ, Poultry Processing | Romania | Disproportionate low-wage corporate monopsony |
| Mississippi | $53.1K | Agriculture, Shipbuilding, Federal Grants | Hungary | Chronic generational poverty and brain drain |
| Idaho | $52.0K | Agriculture, Tech Influx, Construction | Croatia | Influx-driven housing crisis crushing locals |
| Maine | $51.0K | Tourism, Forestry, Marine Harvesters | Bulgaria | Oldest median demographic age in the Union |
| Montana | $50.0K | Tourism, Extraction, Agriculture | Panama | Amenity migration inflating local cost of living |
| Wyoming | $47.0K | Coal, Uranium, Soda Ash, Federal Lands | Costa Rica | Declining global demand for thermal coal |
| New Mexico | $45.0K | Federal Labs, Oil (Permian), Tourism | Malaysia | Persistent educational and poverty deficits |
| Hawaii | $44.0K | Military Logistics, Leisure Tourism | Mauritius | Crippling cost-of-living vs dead-end service wages |
(The Bitter Truth) The bottom 10 states in this table are caught in a classic poverty trap masquerading as post-industrial transition. Despite having nominal access to the world’s deepest financial capital markets, their local populations face structural underemployment, collapsing life expectancy, and escalating debt obligations. They are economic colonies within their own borders, dependent on federal transfers paid for by the tax base of the very coastal states they politically despise.
The “So What?” Factor: The Brutal Ground-Level Realities
Economic data does not live inside sterile spreadsheets. It dictates who eats well, who falls into bankruptcy over a broken bone, and where the next generation will flee. When an analyst reads that New York sits at $117.3K while Mississippi sits at $53.1K, the cold academic abstraction hides a vicious day-to-day reality.
1. For the Everyday Citizen
In California ($105K), that eye-watering per capita figure is an agonizing illusion for an ordinary family. The baseline cost of basic shelter, electricity, and water consumes the overwhelming majority of disposable income. A household earning $90,000 in San Francisco or Los Angeles is effectively lower-middle class, boxed out of real estate equity for life.
Conversely, across the lower tier states like New Mexico ($45K), Maine ($51K), or Mississippi ($53.1K) the low per capita baseline directly correlates with failing public hospitals, decaying schools, and an acute brain drain. The young and the ambitious leave the moment they can hold a degree, abandoning entire counties to aging, dependent populations. The American Dream is no longer an open invitation; it is a geographic lottery.
2. For the Strategic Investor
If you are deploying private equity, venture funds, or corporate capex, this data gives you a clear playbook. The top-tier states are saturated with capital, but their operating margins are being eaten alive by punitive taxation, crippling litigation, and astronomical labor costs.
The immediate play has been the flight to the “Growth Corridors” Texas ($87K), Florida ($86K), and North Carolina ($83K). Yet, these corporate safe havens are now slamming into hard physical limits:
-
Runaway commercial property insurance premiums.
-
Fragile, over-stressed energy grids.
-
Fast-rising municipal borrowing costs.
The smart money is being forced to pick through secondary markets, arbitraging regional cost structures before local wages catch up with coastal real estate prices.
3. For Enterprise and Industry
Industrialists face a painful paradox. If you locate operations in the talent-dense coastal belts of Massachusetts ($110K) or Washington ($108.5K), your payroll and real estate overhead will squeeze you out of global price competition against competitors in Munich, Seoul, or Bangalore.
If you build out in the lower-cost heartland say, Arkansas ($60.3K) or Kentucky ($67K) you secure rock-bottom industrial power rates and tax holidays, but you run head-on into a critical shortage of skilled technical labor. The human capital simply is not there. You end up having to import expensive coastal talent anyway, running your balance sheet ragged on retention packages.
Seasonality, Distortion, and Anomaly Alerts
Do not let these aggregate figures deceive you into thinking every state operates on a stable economic path. Deep structural anomalies distort several of the headline figures in this dataset.
The Permian Basin Mirage: Texas and New Mexico
Take New Mexico ($45K) and Texas ($87K). New Mexico’s position near the bottom seems to clash with the historic production numbers coming out of the Delaware and Permian basins.
The explanation is simple: resource extraction creates corporate capital flows that rarely stick to the ground where they are pulled up. The oil flows out through pipelines to coastal refineries, and the ultimate revenue flows directly into the accounts of institutional investors in Houston, New York, and London.
The local population in southeastern New Mexico deals with shredded public roads, surging local prices, and environmental degradation, while the underlying gross domestic product is booked on financial statements thousands of miles away.
The Corporate Registration Illusion: Delaware
Delaware ($80K) punches well above its demographic weight for one fundamental reason: corporate law arbitrage. More than half of all publicly traded American corporations, including over 65% of the Fortune 500, maintain their legal domicile within the state to take advantage of its Court of Chancery and tax-friendly legal structures.
This metric does not reflect real factories or cutting-edge technical labs operating within Delaware’s borders. It is a paper artifact of mail drops, registered corporate agents, and legal retainers.
The Pandemic Migration Distortion: Florida and Idaho
Between 2020 and 2024, states like Florida ($86K) and Idaho ($52K) experienced an unprecedented influx of remote-work capital, untethered from coastal corporate offices. This migratory surge artificially boosted local service revenues, drove speculative real estate bubbles, and temporarily inflated state ledgers.
By 2025-2026, that sugar rush faded. Remote workers are either being forced back into urban corporate centers under strict return-to-office mandates, or finding their purchasing power crushed as local home insurance premiums in Florida climb over 400%, pricing them straight out of their newly bought sunbelt dream.
Macro-Economic Scenarios: The Bull vs. Bear Paradox
How does this widening $70,000 fault line resolve itself over the remainder of this decade? Two distinct, competing dynamics are fighting for control of the American economic engine.
The Bull Case: The Decentralized Re-Industrialization
Under this model, the extreme cost profile of the elite coastal states accelerates the dispersion of productive capital across the American interior. The massive deployment of capital from the CHIPS Act, the Inflation Reduction Act, and private infrastructure funds finally begins to pay off.
Advanced semiconductor fabrication sites in Ohio ($81K), clean-energy manufacturing clusters in Tennessee ($75K), and aerospace corridors in Alabama ($66K) pull the middle and lower tiers out of their low-margin traps.
Distributed artificial intelligence infrastructure allows technical operations to run efficiently outside major metropolitan markets, driving productivity across the American interior. The national baseline climbs toward $95,000, with the lowest tier breaking through the $60,000 floor by 2030. Wealth distributes naturally along efficient regional supply chains.
The Bear Case: The Securitized Neofeudal State
In the Bear scenario, the coastal monopolies tighten their grip on national output. Generative AI development and advanced financial engineering concentrate power into a tiny handful of dominant coastal platforms based in California, Washington, and New York.
The manufacturing renaissance in the Rust Belt and the Sunbelt stalls, choked by soaring electricity costs, water scarcity in the Southwest, and high debt refinancing rates. The interior states turn into hollowed-out distribution corridors and data-center colonies, providing raw power, land, and water to coastal tech firms while capturing almost none of the long-term tax base or equity gains.
The federal government, crushed under a national debt load careening past 130% of GDP, is forced to cut federal transfer payments and healthcare spending. Deprived of those critical federal flows, states like Mississippi ($53.1K), Arkansas ($60.3K), and West Virginia ($60.8K) spiral into outright insolvency, turning the bottom third of the country into a vast Rust Belt reserve.
The Alternative Narrative: The Systemic Rupture Scenario
What happens if the current macroeconomic playbook falls apart entirely? Consider the alternative scenario: The Sovereign Asset Repricing Crisis.
Suppose the long-term yield on the US 10-Year Treasury breaks decisively and permanently above 6.0%, triggered by foreign sovereign selling, persistent fiscal deficits, and the steady loss of global reserve dominance. In that environment, the debt-fueled growth engine of the coastal economies seizes up.
Wall Street’s private equity valuations in New York ($117.3K) depend heavily on ultra-cheap leverage. The venture capital lifelines sustaining pre-profit tech hubs in Massachusetts ($110K) and California ($105K) dry up overnight.
Suddenly, the financialized and tech-heavy coastal models experience an aggressive, multi-year deflationary collapse. In contrast, jurisdictions that control real, physical, non-negotiable assets the oil fields of Texas ($87K), the grain infrastructure of Iowa ($63K), and the freight networks of Illinois ($92K) suddenly discover unexpected pricing power.
The paper wealth of the coasts evaporates, while the industrial and agricultural heartland reasserts its real economic value. Such an economic shock would not narrow the gap by pulling the bottom up; it would violently drag the top down, cutting federal tax collections and plunging the entire union into prolonged fiscal austerity.
Strategic Blueprint: Federal and Sub-National Action Matrix
The conventional policy response simply sending federal grants to low-performing states has failed completely. It acts as an economic narcotic, creating institutional dependency without building genuine local wealth engines. The divergence can only be closed through direct, aggressive structural intervention.
| Policy Pillar | Primary Regional Target | Tactical Implementation Plan | 2030 Deliverable Target | Capital Allocator Action |
| Grid Modernization & Nuclear Deployment | Midwest & Interior South | Build out small modular reactors (SMRs) to feed high-demand factories directly. | Lower commercial power costs by 25% across Tier-3 states. | Long industrial utility equity; short unhedged coastal utilities. |
| Human Capital Rework | Appalachia & Deep South | Replace generalist public university systems with technical polytechnic centers. | Boost skilled machinist & technician pools by 40%. | Direct private investment into specialized technical education. |
| Tax-Code De-Financialization | Coastal Financial Hubs | Eliminate carried interest tax shelters; tax short-term algorithmic trading. | Redirect $150B annually toward physical industrial capex. | Reduce exposure to private equity vehicles; rotate into real assets. |
| Water Infrastructure Mobilization | Southwest Corridor | Build pipeline and desalination networks across Arizona, Nevada, and Utah. | Guarantee long-term water rights for chip foundries. | Buy municipal water infrastructure debt; short high-exposure real estate. |
(The Golden Opportunity) Capital allocators who look past broad macroeconomic averages can exploit massive structural mispricings. Building high-value manufacturing and compute-adjacent industrial capacity in states like Indiana ($72K) or Tennessee ($75K) lets you capture lower labor, real estate, and municipal costs while locking in federal subsidies yielding risk-adjusted returns that over-saturated coastal markets can no longer match.
Global Echo: The Lessons for India’s 2030–2047 Roadmap
For economic policymakers in New Delhi, this American divergence is a flashing red warning sign. As India marches toward Vision 2047 (Viksit Bharat) and works to cross the threshold into a $10 Trillion economy, it is in danger of sleepwalking into the exact same trap.
Consider the parallel. India’s wealth generation is already concentrating heavily within a handful of advanced, industrialized, coastal and peninsular states: Maharashtra, Tamil Nadu, Gujarat, and Karnataka. These states are racing toward high-middle-income status, powered by service exports, industrial corridors, and deep maritime trade connections.
On the other side of the ledger, the vast demographic heartland Bihar, Uttar Pradesh, and Jharkhand is fighting to break free from a low-income trap. If India relies entirely on a services-heavy, capital-light growth model, it risks creating its own permanent internal divergence: an elite coastal knowledge economy floating above an impoverished, non-industrialized interior.
To avoid the deep regional divides now fracturing the American economy, India must execute a decisive, unified industrial strategy:
-
Aggressive Freight Equalization and Logistics Upgrades: The Dedicated Freight Corridors (DFCs) must be completed and linked directly to the interior, dropping inland transport costs to coastal levels.
-
Mass-Scale Manufacturing Parks: Instead of prioritizing automated software campuses, state-level policy must build out labor-intensive manufacturing clusters in the central and northern plains, absorbing millions of agricultural workers into industrial payrolls.
-
Decentralized Energy Grids: Ensure the push for renewable power and nuclear capacity does not stall in wealthy states, but powers heavy industrial belts across eastern and central India.
If India ignores these structural lessons, it will build a fractured republic of its own: an enclave of high-earning tech centers surrounded by hundreds of millions of disaffected citizens trapped in an economic backwater.
Strategic Verdict: The Horizon to 2047
1. The Horizon to 2030: The Acceleration of Spatial Arbitrage
Over the next four years, the headline national metric of $79.9K will become an increasingly useless figure for global investors. The real economy will split into three distinct, competing tiers:
-
The hyper-capitalized coastal citadels (New York, California, Washington) will continue to post eye-catching nominal figures, but their actual real economic influence will shrink as high costs of living and chronic public deficits hollow out their middle-class tax bases.
-
The Sunbelt and Mountain corridors (Texas, North Carolina, Tennessee, Utah) will see rapid capital deployment, but will be forced to spend unprecedented sums fixing infrastructure bottlenecks, securing water rights, and stabilizing power grids.
-
The bottom tier will stay stuck in structural decline unless the federal government stops relying on passive welfare subsidies and begins deploying targeted, direct industrial capital.
2. The Horizon to 2047: The Fracture of the Dollar Space
Looking out toward the centenary of post-war global dominance, the United States cannot sustain a stable currency and political union while tolerating a persistent 160%+ per capita output gap among its constituent states.
If this gap continues to widen, the economic consensus that anchored the post-Cold War era will collapse from within. Sub-national regional blocs will emerge, pushing for distinct state-level financial systems, custom regulatory frameworks, and targeted trade barriers to protect local markets from unchecked coastal capital.
The world will no longer negotiate with a single, unified American economic superpower. Global powers will be forced to build direct, bilateral trade and investment partnerships with specific regional economic blocs within the continent itself.
Strategic Directive for Decision-Makers
-
Corporate Treasuries: Stop treating the United States as a single, uniform sovereign market. Segment your capital investments, counterparty risk assessments, and facility plans based on local balance-sheet resilience, not federal aggregates.
-
Global Asset Allocators: Cut exposure to over-leveraged, debt-heavy commercial assets in Tier-1 coastal centers. Rotate that capital into primary productive infrastructure, energy generation, and specialized technical supply chains located across the resilient middle tier.
-
Emerging Market Strategists: Take note of the American model’s structural design flaws. Build decentralized industrial networks now. Do not trade real, long-term industrial capability for the quick sugar rush of paper wealth and financial asset inflation.
GOOGLE ‘PEOPLE ALSO ASK’ FAQs
Q1: Which US state has the highest GDP per capita?
A: New York leads the nation at $117.3K per capita, driven by concentrated Wall Street financial services, private equity management fees, and corporate legal transactions. This exceeds sovereign benchmarks like Switzerland and tops the national baseline of $79.9K by over 46%.
Q2: Which US state has the lowest GDP per capita?
A: Hawaii ranks lowest at $44K, followed closely by New Mexico at $45K. These states suffer from non-scalable economic pillars dominated by seasonal tourism or raw extraction, where operational profits are systematically siphoned out to coastal institutional headquarters.
Q3: Why is the per capita income gap widening between US states?
A: A 166% divergence stems from structural capital concentration in intellectual property, cloud architecture, and financial monopolies across coastal hubs like Washington and California. Meanwhile, interior and southern manufacturing states battle automated supply chains, aging workforces, and stagnant industrial margins.
Q4: How does US state GDP per capita compare to global economies?
A: Top-tier states like Massachusetts ($110K) generate more nominal output per person than Germany (~$54K) and Japan (~$34K) combined. However, bottom-tier states like Mississippi ($53.1K) align directly with lower-tier European economies, revealing extreme regional sovereign disparity.
Q5: What are the economic risks for the US economy toward 2030 and 2047?
A: By 2030, persistent regional imbalances risk destabilizing federal municipal debt and triggering severe spatial capital flight away from high-tax zones. Continuing this trajectory to 2047 threatens the domestic monetary union, forcing sub-national economic blocs to emerge.
Data Source:
- U.S. Bureau of Economic Analysis (BEA)
- Federal Reserve Economic Data (FRED)
- International Monetary Fund (IMF)
- World Economic Outlook
Disclaimer: This report is for informational and analytical purposes only and does not constitute formal financial, investment, or policy advice.