The Great Indian Engineering Bubble: Inside the 8,917-Campus Empire and the Looming Demographic Disillusionment
NEW DELHI, India — India has constructed the largest private technical education apparatus in human history, housing 8,917 technical and engineering institutions across its geography, yet 83% of its graduating engineers remain fundamentally unemployable in core global technology sectors.
We are looking at an educational assembly line that consumes ₹1.8 trillion ($21.6 billion) in private household savings annually. It churns out paper degrees while leaving hundreds of thousands of youth stranded at the bottom of the service economy.
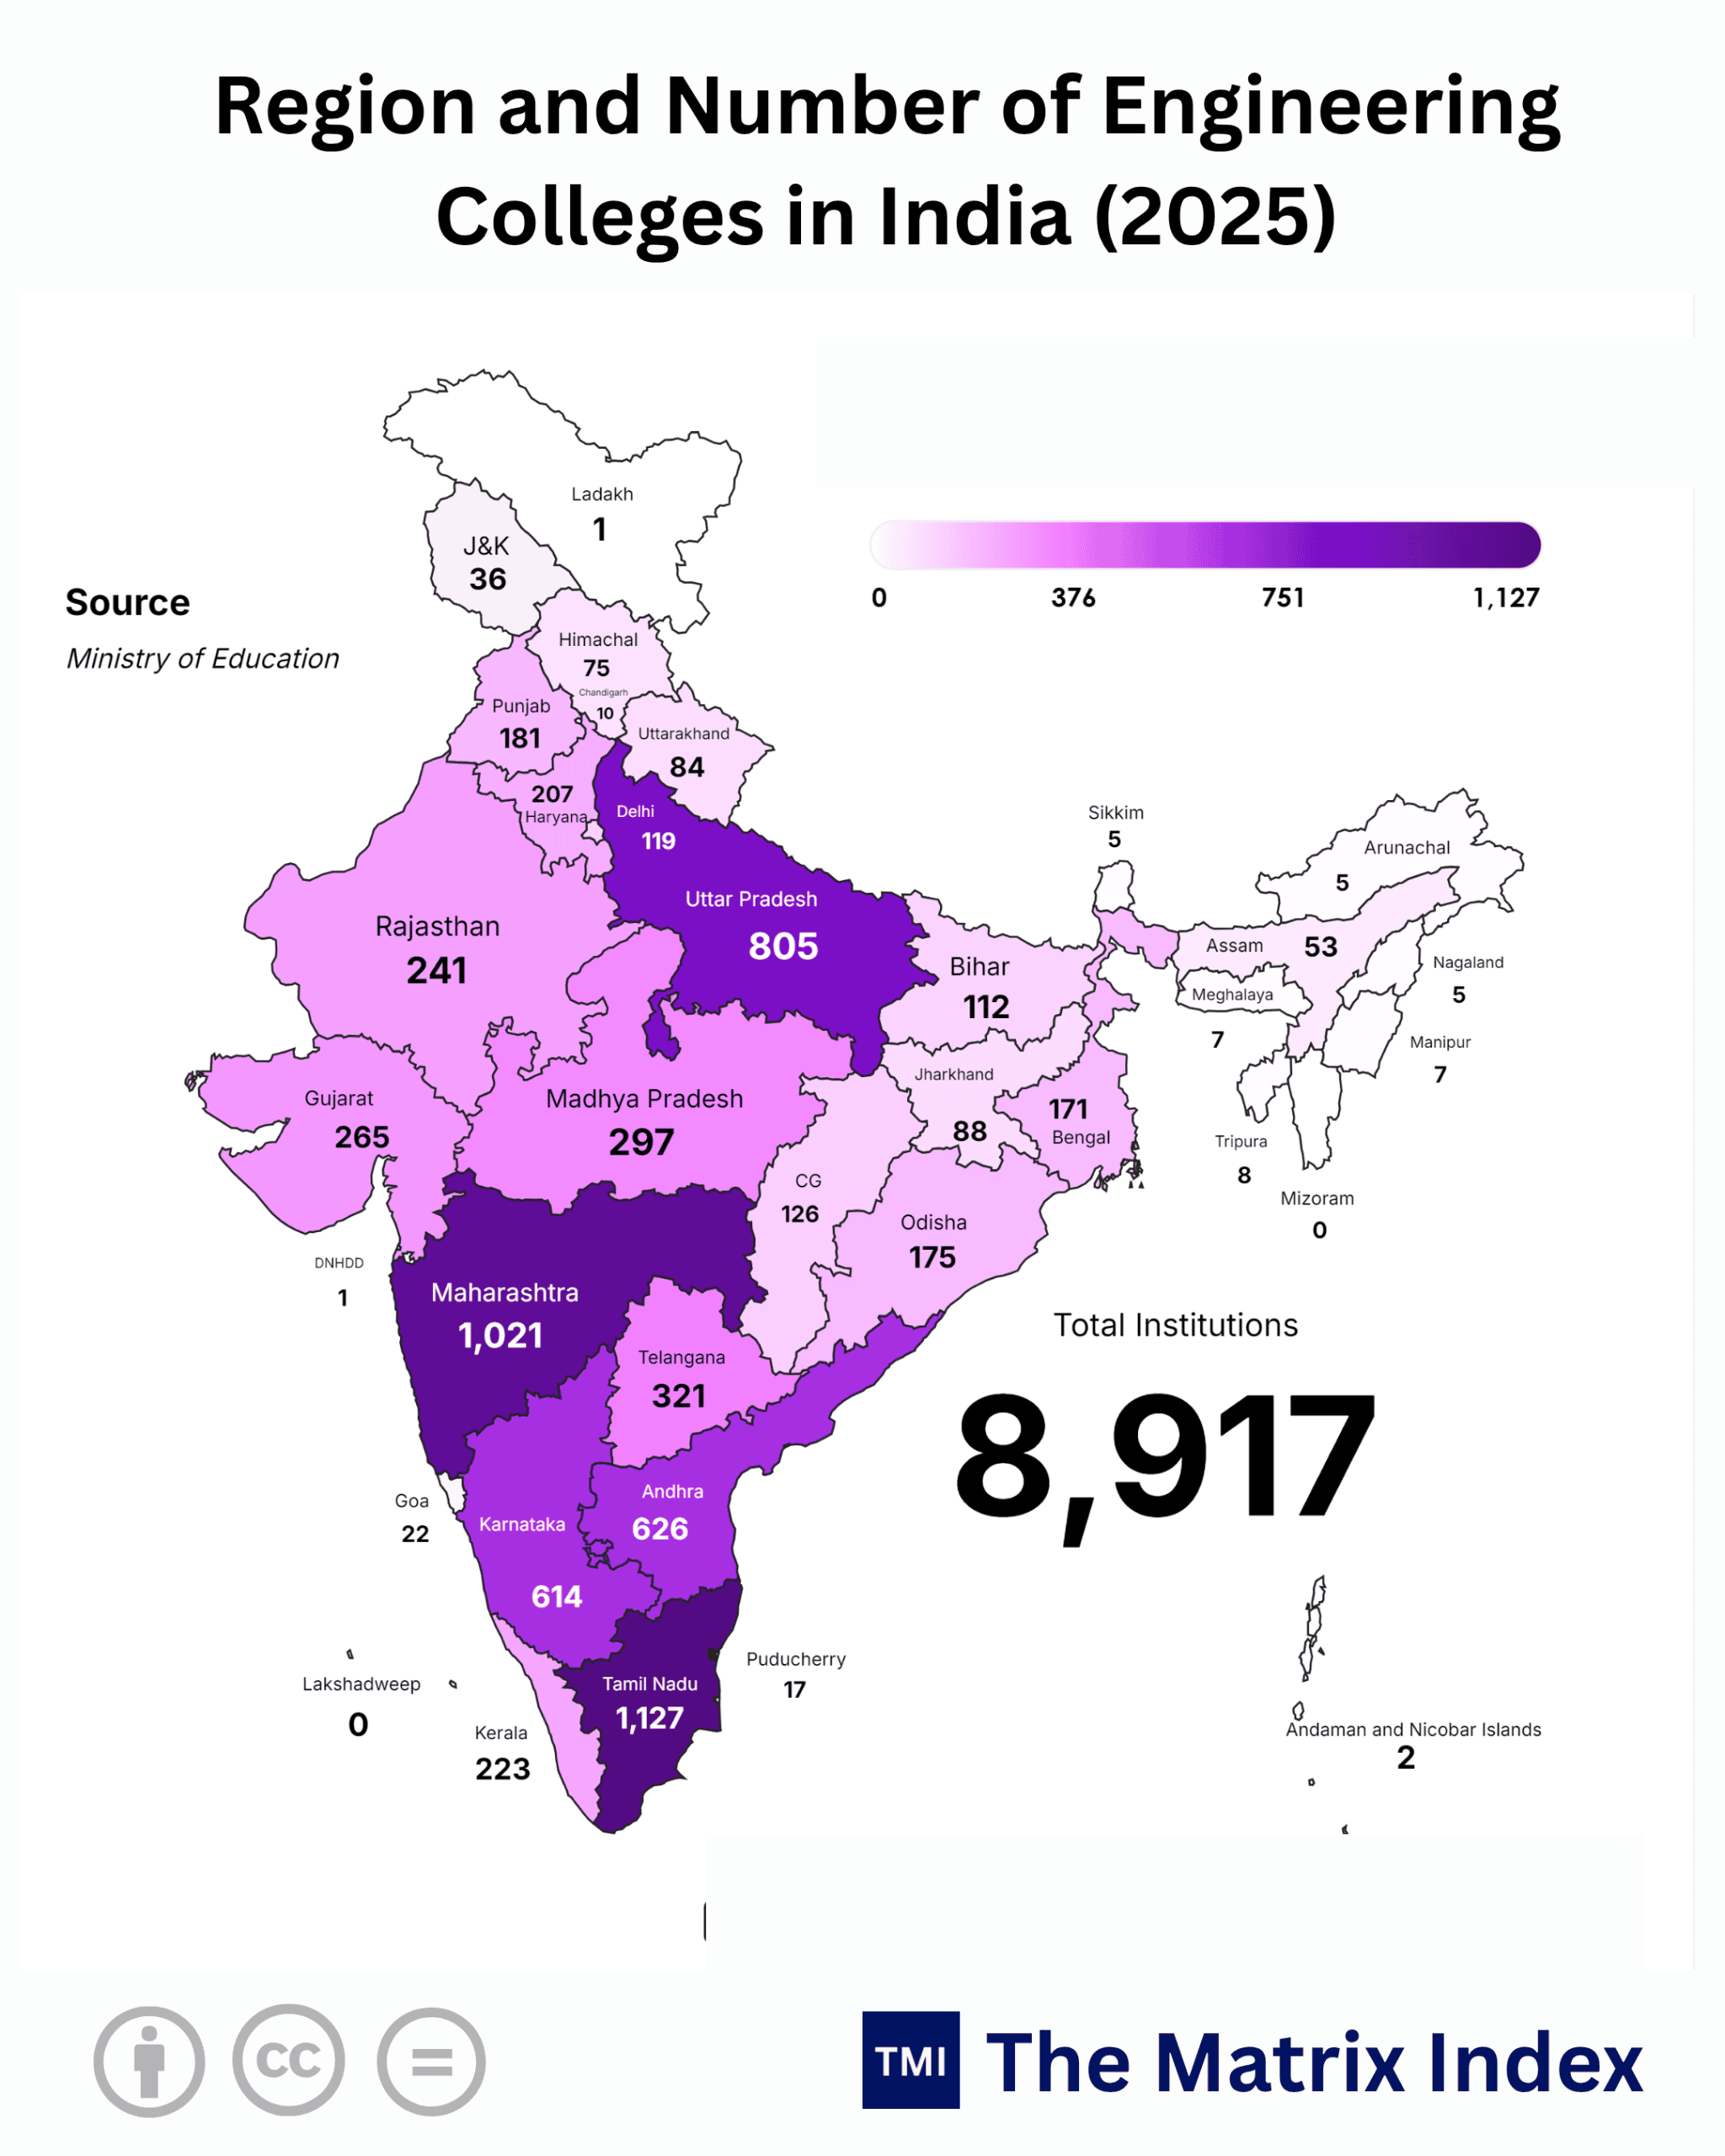
Look closely at the geographic distribution across the map. This is not an academic triumph; it is a real estate and political arbitrage scheme masquerading as higher education.
The Asymmetric Cartography: How Five States Built an Engineering Monolith
The southern peninsula and western industrial belt hold an overwhelming monopoly on India’s technical seats. Five southern states Tamil Nadu (1,127), Andhra Pradesh (626), Karnataka (614), Telangana (321), and Kerala (223) host 2,911 engineering institutions. When paired with Maharashtra (1,021), these six states account for 3,932 colleges, or 44.1% of India’s entire engineering footprint.
Consider the distortion: Tamil Nadu (1,127 colleges) boasts nearly ten times the institutional capacity of Bihar (112 colleges), despite Bihar housing nearly double Tamil Nadu’s youth demographic. Uttar Pradesh (805 colleges), carrying a population exceeding 240 million equivalent to Pakistan or Brazil has fewer institutions than Maharashtra (1,021 colleges).
Why did this structural imbalance emerge?
Between 1995 and 2012, southern state governments deregulated institutional licensing. Local political dynasties, sugar cooperatives, and construction conglomerates converted agricultural landbanks into self-financing educational trusts. Engineering colleges became tax-sheltered cash pipelines, charging heavy capitation fees during the initial IT outsourcing boom led by TCS, Infosys, and Wipro.
The north and east relied on bureaucratic state universities, starving their domestic youth of seats and triggering a massive intra-national student migration corridor toward Chennai, Bengaluru, and Pune.
Comprehensive State-by-State Institutional Distribution
Below is the exhaustive distribution of India’s 8,917 engineering and technical institutions across all 36 States and Union Territories.
Global Benchmarking: Institutional Velocity vs. Economic Value
How does India’s sprawling institutional machinery compare against Tier-1 innovation superpowers and industrial rivals?
The United States (Tier-1): Elite Concentration vs. Mass Production
The US produces roughly 210,000 engineering graduates annually across 600 accredited institutions. Supported by institutions like MIT, Stanford, and Berkeley, this system focuses heavily on basic research and private venture integration. US institutions channel $90+ billion annually into university-level R&D.
India’s 8,917 campuses receive less than $1.8 billion combined in research grants outside the elite IIT/IISc system. The outcome: the US generates foundational compute architectures, operating systems, and foundational AI models; India supplies application maintenance and service engineers.
Germany (Tier-1): The Industrial Dual-Education Standard
Germany’s Fachhochschulen operate on the Duales Studium framework: students alternate between classroom theory and hands-on apprenticeship at Mittelstand industrial manufacturers.
India’s private engineering campuses rarely have functional machine shops or updated microelectronic labs. Students routinely graduate with theoretical knowledge of outdated codebases and industrial paradigms from the 1990s.
Japan (Tier-1): Monozukuri Precision
Japan’s technical framework focuses on Monozukuri (the art of manufacturing precision). It integrates institutional hardware engineering with automotive and robotics giants like Toyota, Fanuc, and Sony.
India’s engineering expansion skipped manufacturing integration entirely, jumping straight to low-tier software services. As a result, India faces acute shortages of precision hardware, semiconductor packaging, and mechatronics talent—even with 8,917 colleges operating nationwide.
China (Tier-2 Competitor): Targeted Industrial Scaling
China produces roughly 1.4 million STEM graduates each year across fewer institutions than India. Backed by government initiatives like Project 985, Chinese universities tie their research directly to strategic industrial goals: battery chemistry, photovoltaic manufacturing, hypersonic aerodynamics, and high-node lithography.
India’s engineering expansion remains uncoordinated: private institutions continue minting redundant Computer Science degrees while the country imports over 70% of its capital manufacturing equipment.
The “So What?” Factor: Household Ruin, Investor Traps, and Corporate Decay
Why does this institutional imbalance matter beyond the education sector? It sends direct ripple effects through household balance sheets, capital markets, and corporate productivity.
1. The Middle-Class Household Balance Sheet
For an average Indian family earning ₹4-8 Lakhs ($4,800 – $9,600) annually, financing a four-year private engineering degree costs between ₹8-16 Lakhs. Families regularly liquidate productive farmland or take high-interest collateralized loans on the promise of an IT career.
When the graduate lands a ₹2.4 to ₹3.6 LPA entry-level service role—a nominal figure that has remained flat for nearly two decades—the internal rate of return (IRR) turns negative. Families lose valuable capital, while the student begins their career trapped in debt.
2. The Venture and Corporate Trap
Global institutional investors pour billions into Indian software and consumer-tech ventures expecting a massive pool of cheap, top-tier engineering talent. Instead, they hit an operational bottleneck:
This dynamic drives up payroll costs for elite domestic engineering teams. Indian tech enterprises end up paying Silicon Valley-level base salaries to a small tier of qualified engineers, while millions of under-trained degree holders struggle to find relevant work.
3. Industry Rerouting
Indian IT service firms spend upwards of $1.5 billion annually on corporate training academies simply to teach new hires modern engineering principles. This dynamic turns our largest tech firms into remedial schooling systems, eating into operating margins and slowing the shift toward higher-margin software products.
5. Seasonality & Anomaly Alert: The 2026 AI Disruption
What we are witnessing in 2026 is not a regular cyclical slowdown—it is a structural break.
For twenty years, India’s mass engineering model relied on large-scale IT service hiring. Firms absorbed 350,000 to 450,000 fresh graduates annually to handle tasks like basic manual testing, legacy code migration, maintenance, and system administration.
That business model is evaporating:
-
Automated code synthesis and DevOps platforms have largely automated entry-level coding tasks.
-
Global enterprises are prioritizing lean, high-output engineering teams over large, low-cost support units.
-
The mass campus recruitment pipeline has dropped over 55% compared to its 2021 peak.
This is an existential issue for the 8,917 campuses. Over 6,000 of these institutions operate with unaccredited faculty, zero research budgets, and computer labs running outdated curricula. They cannot pivot to train students in specialized areas like kernel optimization, spatial computing, or distributed systems.
Two-Sided Risk Assessment: The Bull vs. Bear Case
The Bull Case: Deep-Tech Re-Anchoring and Consolidation
-
Market pressures force the closure or merger of 2,500–3,000 non-viable Tier-3/4 colleges by 2030, cutting excess, low-quality seat capacity.
-
The expansion of Global Capability Centers (GCCs) across Bengaluru, Hyderabad, Pune, and NCR shifts local hiring toward advanced R&D, systems engineering, and VLSI design.
-
State initiatives in Karnataka, Tamil Nadu, and Telangana successfully modernize university curricula, integrating real-world foundry work and industrial apprenticeships.
-
India moves up the value chain from software maintenance to advanced systems integration, enterprise AI deployment, and global infrastructure engineering.
The Bear Case: The Zombie Campus Trap and Economic Drag
-
State governments preserve non-viable private colleges through artificial subsidies and lowered examination standards to protect regional political interests.
-
Millions of under-skilled graduates enter the labor market each year, unable to secure engineering roles and increasing pressure on informal gig and delivery economies.
-
Global tech firms bypass India for higher-value R&D, shifting complex development to hubs in Eastern Europe, Vietnam, and Latin America.
-
A growing divide develops between a small cohort of well-compensated elite engineers and a large population of underemployed graduates, creating broader economic strain.
The Alternative Scenario: Strategic Shock and Systemic Pivot
What happens if global tech firms cut reliance on third-party IT integration by 40% through internal automation over the next 36 months?
If enterprise demand for traditional entry-level tech services drops sharply, India cannot rely on standard curricular tweaks. The country would need an immediate restructuring of its educational infrastructure:
-
Repurposing Campus Real Estate: State governments must encourage non-viable Tier-3 campuses to convert into hands-on polytechnics, precision machining centers, and hardware assembly hubs.
-
Revamping Vocational Technical Trades: Elevate precision trades—such as CNC machining, aerospace component fabrication, and EV powertrain assembly—to professional, well-compensated technical careers.
-
Decoupling Degree Certification: Allow technology enterprises to bypass university credentials entirely in favor of transparent, open-source skill registries and verified portfolio assessments.
Strategic Regional Archetypes
Below is a regional analysis of India’s technical education capacity, outlining structural realities and transition priorities across key industrial zones.
Final Strategic Verdict: Roadmap to 2030–2047
By 2047, India aims to reach developed-nation economic status (Viksit Bharat). That milestone will not be achieved on the back of paper credentials from under-equipped private colleges.
Strategic Imperatives:
-
Aggressive Institutional Deregistration: The National Board of Accreditation (NBA) and AICTE must establish a strict floor: colleges that fail to achieve 50% verified industry placement rates over three consecutive years should lose their engineering accreditation.
-
Tripling R&D Allocations: Lift India’s gross R&D expenditure from its long-standing 0.65% of GDP to at least 2.5% by 2035, funneling grants directly into experimental labs and industry-linked research programs.
-
Ending the CS Degree Monopoly: Engineering education must shift away from basic software coding toward high-demand physical and applied sciences: advanced metallurgy, mechatronics, power electronics, synthetic biology, and aerospace manufacturing.
-
Transparent Employability Reporting: Mandate that all technical institutions publicly disclose independently audited median starting salaries, standardized assessment scores, and verified career outcomes.
The era of easy growth through mass-market engineering degrees is over. India’s economic future depends on whether it can transform its vast campus network into a high-caliber engine for genuine technical innovation and precision manufacturing.
GOOGLE ‘PEOPLE ALSO ASK’ FAQs
Q1. How many engineering colleges are there in India?
India operates 8,917 engineering and technical institutions, with Tamil Nadu (1,127) and Maharashtra (1,021) holding the highest concentration. Over 44% of this nationwide capacity is concentrated in just six southern and western states.
Q2. What percentage of engineering graduates in India are unemployable?
Approximately 83% of graduating engineers lack essential core technology competencies required by global industry benchmarks. This deficit costs domestic households an estimated ₹1.8 trillion ($21.6 billion) in capital investments each year.
Q3. Which Indian state has the highest number of engineering institutions?
Tamil Nadu leads the country with 1,127 technical institutions, representing 12.64% of the national total. In contrast, populous states like Bihar possess only 112 institutions, creating severe regional training deficits.
Q4. Why is campus recruitment declining across Indian engineering colleges?
Over 55% of entry-level software intake has declined due to rapid workflow automation and modern developer tooling. Enterprise hiring models have shifted away from mass campus batches toward lean, specialized systems engineering roles.
Q5. What structural reforms are planned for India’s engineering sector by 2030?
Projections indicate the closure or merger of 2,500 to 3,000 non-viable Tier-3 campuses by 2030. Policy directives require shifting curriculum models toward precision manufacturing, semiconductor packaging, and direct industrial co-op programs.
Data Source:
- Ministry of Education (MoE)
- All India Council for Technical Education (AICTE)
- National Board of Accreditation (NBA)
Disclaimer: This report is for informational and analytical purposes only and does not constitute formal financial, investment, or policy advice.