Blood on the Ledger: The Terrifying Macroeconomic Balance Sheet of America’s Gun Violence Epidemic
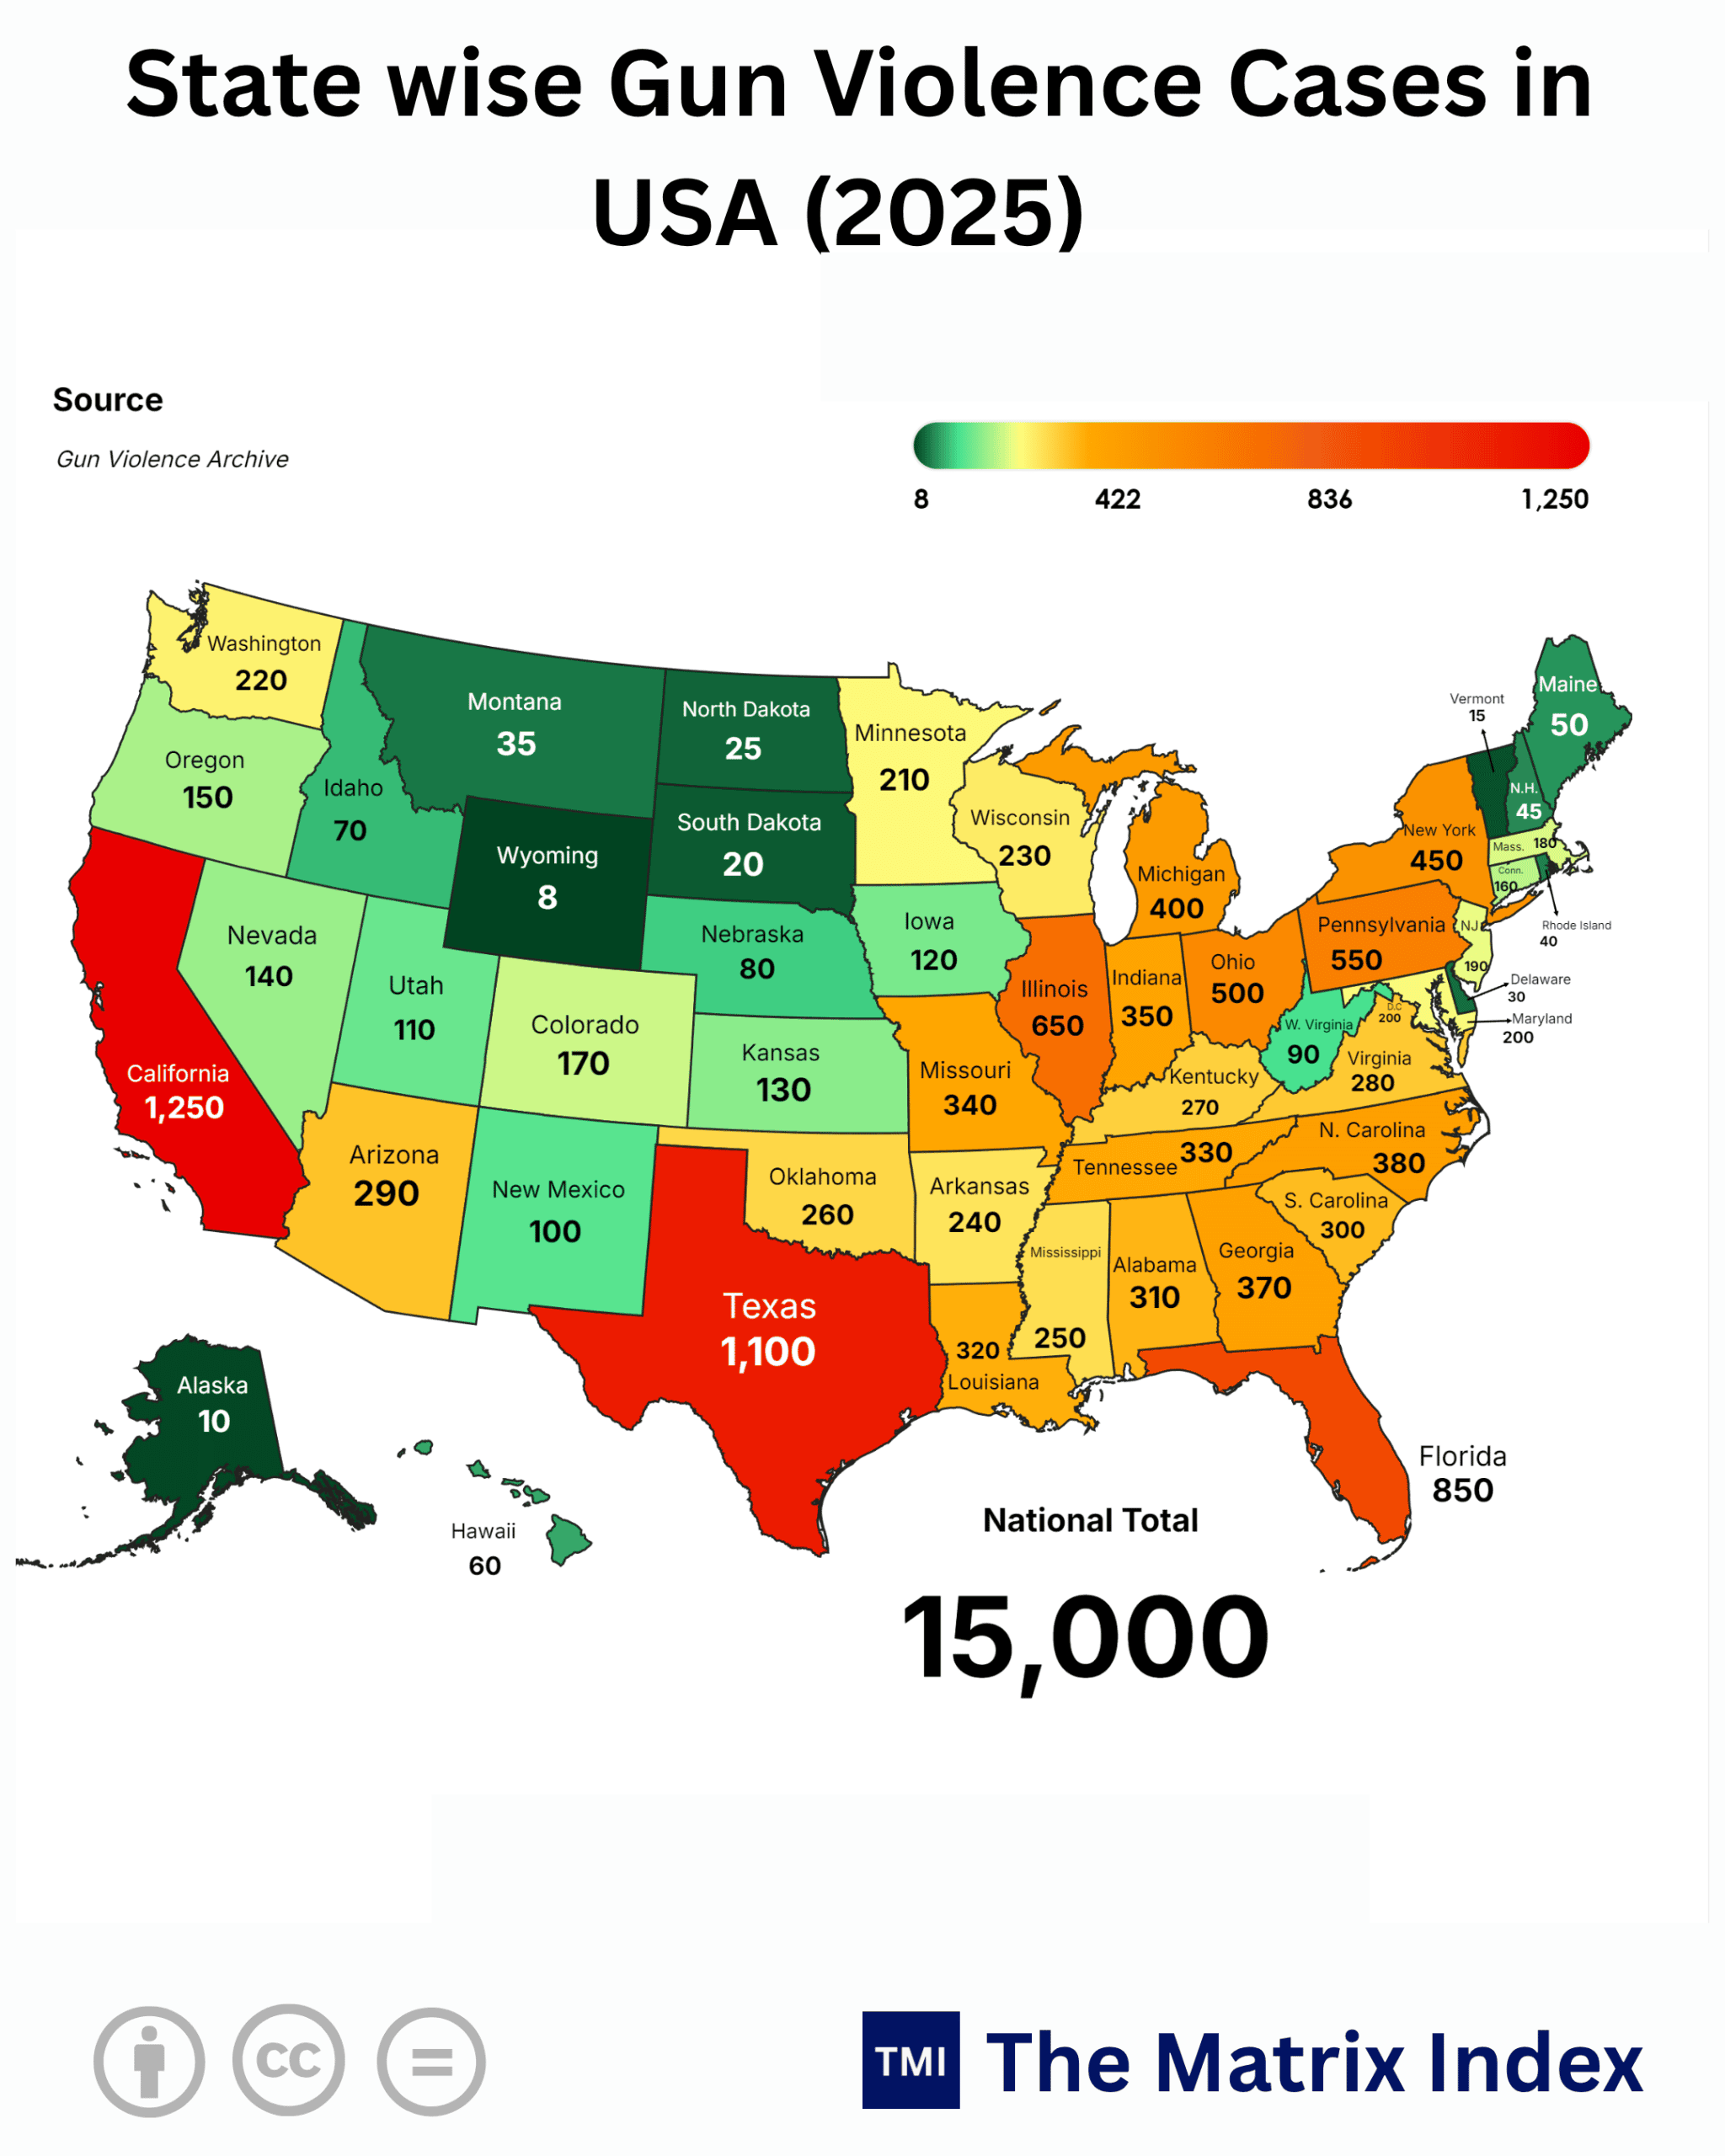
| State | Gun Violence Cases (2025) |
| California |
1,250 |
| Texas |
1,100 |
| Florida |
850 |
| Illinois |
650 |
| Pennsylvania |
550 |
| Ohio |
500 |
| New York |
450 |
| Michigan |
400 |
| Washington |
220 |
| N. Carolina |
380 |
| Georgia |
370 |
| Indiana |
350 |
| Missouri |
340 |
| Tennessee |
330 |
| Louisiana |
320 |
| Alabama |
310 |
| S. Carolina |
300 |
| Arizona |
290 |
| Virginia |
280 |
| Kentucky |
270 |
| Oklahoma |
260 |
| Mississippi |
250 |
| Arkansas |
240 |
| Wisconsin |
230 |
| Minnesota |
210 |
| Oregon |
150 |
| Maryland |
200 |
| Colorado |
170 |
| Nevada |
140 |
| Kansas |
130 |
| Iowa |
120 |
| Utah |
110 |
| New Mexico |
100 |
| W. Virginia |
90 |
| Nebraska |
80 |
| Idaho |
70 |
| Hawaii |
60 |
| Maine |
50 |
| N.H. (New Hampshire) |
45 |
| Montana |
35 |
| Delaware |
30 |
| North Dakota |
25 |
| South Dakota |
20 |
| Mass. (Massachusetts) |
180 |
| Conn. (Connecticut) |
160 |
| N.J. (New Jersey) |
190 |
| Vermont |
15 |
| Alaska |
10 |
| Wyoming |
8 |
| National Total |
15,000 |
NEW DELHI, India (October 20, 2026 / IST) — While Wall Street analysts obsess over basis-point adjustments by the Federal Reserve and debate terminal interest rate paths, they remain willfully blind to the most predatory, compounding drag on Western economic sovereignty: the staggering, irreversible capital destruction caused by civilian ballistics.
Gun violence in the United States is treated by corporate media as a perpetual cultural soapbox or a moral grievance. That narrative is obsolete. It is a mathematical lie designed to obscure cold, balance-sheet bankruptcy. Gun violence is not an isolated social pathology; it is an economic bleed outrunning municipal tax receipts, eroding human capital pipelines, and hollowing out Tier-1 state balance sheets from within.
When 15,000 primary gun violence incidents tear through the economic fabric of a nation within a single calendar year (2025), the fallout is not confined to emergency rooms. It strikes municipal bond yields. It forces corporate capital expenditures into perimeter security over research and development, and imposes a perpetual fiscal penalty across state borders.
Look at the ledger without sentimentality. Capital is ruthless: it compounds where it is protected, and it flees where sovereign security disintegrates.
The Cold Geometry of the 2025 Bloodbath: Deconstructing State-by-State Loss
The 2025 national baseline of 15,000 primary gun violence incidents across the United States reveals violent market failure masquerading as constitutional liberty. The geographic distribution of this carnage does not trace political rhetoric; it tracks regional economic density and systemic municipal decay.
The top two economic juggernauts of the American Union California and Texas bear the heaviest structural toll. California, boasting an isolated nominal GDP exceeding $3.9 Trillion (rivaling Germany and Japan), registered 1,250 severe gun violence incidents in 2025. Texas, the nation’s premier corporate tax haven and energy powerhouse, recorded 1,100 incidents.
Together, these two states account for 2,350 incidents over 15.6% of the entire national bleed.
The standard political deflection insists that legislative posture dictates these outcomes. Red-state advocates point fingers at the high incidence in strictly regulated California (1,250 cases), Illinois (650 cases), and New York (450 cases). Blue-state advocates counter by pointing to Texas (1,100 cases), Florida (850 cases), and the per-capita human shredder active across the Deep South: Georgia (370), North Carolina (380), Tennessee (330), and Louisiana (320).
Both political arguments are analytically bankrupt. The crisis is structural, economic, and systemic.
The Macroeconomic Ledger of 2025 State Gun Violence Incidents
The data below presents the state-by-state baseline of primary gun violence incidents compiled for 2025, mapping regional volume directly against structural economic exposure.
| State Jurisdiction | Total Incidents (2025) | Share of National Total (%) | Economic Exposure Index |
| California | 1,250 | 8.33% | Severe / High Capital Flight Risk |
| Texas | 1,100 | 7.33% | Severe / Municipal Deficit Expansion |
| Florida | 850 | 5.67% | High / Tourism & Service Tax Drag |
| Illinois | 650 | 4.33% | Critical / Commercial Real Estate Exit |
| Pennsylvania | 550 | 3.67% | High / Post-Industrial De-skilling |
| Ohio | 500 | 3.33% | High / Regional Outmigration |
| New York | 450 | 3.00% | Critical / Commercial District Discount |
| Michigan | 400 | 2.67% | Moderate / Manufacturing Hub Drag |
| North Carolina | 380 | 2.53% | Moderate / Tech Corridor Friction |
| Georgia | 370 | 2.47% | High / Logistics & Urban Flight |
| Indiana | 350 | 2.33% | Moderate / Infrastructure Friction |
| Missouri | 340 | 2.27% | Critical / Elevated Per-Capita Trauma |
| Tennessee | 330 | 2.20% | High / Urban Core Commercial Erosion |
| Louisiana | 320 | 2.13% | Critical / Public Healthcare Insolvency |
| Alabama | 310 | 2.07% | High / Deep Rural Labor Underutilization |
| South Carolina | 300 | 2.00% | Moderate / Coast-Inland Wealth Divide |
| Arizona | 290 | 1.93% | Moderate / Sunbelt Inflow Chokepoints |
| Virginia | 280 | 1.87% | Low-Moderate / Defense Corridor Moat |
| Kentucky | 270 | 1.80% | Moderate / Public Balance Sheet Stress |
| Oklahoma | 260 | 1.73% | Moderate / Energy Sector Labor Drag |
| Mississippi | 250 | 1.67% | Critical / High Per-Capita Fiscal Drain |
| Arkansas | 240 | 1.60% | Moderate / Labor Retention Deficits |
| Wisconsin | 230 | 1.53% | Moderate / Manufacturing Base Friction |
| Washington | 220 | 1.47% | Low-Moderate / Urban Core Real Estate Squeeze |
| Minnesota | 210 | 1.40% | Moderate / Corporate Headquarters Friction |
| Maryland | 200 | 1.33% | High / Mid-Atlantic Urban Stress |
| New Jersey | 190 | 1.27% | Low-Moderate / High Public Safety Spend |
| Massachusetts | 180 | 1.20% | Low / High-Skill Capital Preservation |
| Colorado | 170 | 1.13% | Moderate / Metro Densification Risk |
| Connecticut | 160 | 1.07% | Low / Concentrated Sub-Regional Trauma |
| Oregon | 150 | 1.00% | Moderate / Retail Commercial Strip Evacuation |
| Nevada | 140 | 0.93% | High / Leisure Sector Volatility |
| Kansas | 130 | 0.87% | Low-Moderate / Agricultural Hub Stability |
| Iowa | 120 | 0.80% | Low / Stable Demographic Insulation |
| Utah | 110 | 0.73% | Low / High Labor Cohesion Moat |
| New Mexico | 100 | 0.67% | Moderate / Chronic Public Health Deficit |
| West Virginia | 90 | 0.60% | Moderate / Aging Workforce Attrition |
| Nebraska | 80 | 0.53% | Low / Agricultural Asset Resilience |
| Idaho | 70 | 0.47% | Low / In-Migration Real Estate Premium |
| Hawaii | 60 | 0.40% | Low / Isolated Tourism Sanctuary |
| Maine | 50 | 0.33% | Low / Demographic Aging Stability |
| New Hampshire | 45 | 0.30% | Low / High Median Income Shield |
| Montana | 35 | 0.23% | Low / Low Density Spatial Defense |
| Delaware | 30 | 0.20% | Low-Moderate / Corporate Sanctuary |
| North Dakota | 25 | 0.17% | Low / Resource-Extractive Base Moat |
| South Dakota | 20 | 0.13% | Low / Financial Processing Enclave |
| Vermont | 15 | 0.10% | Low / Micro-Demographic Insulation |
| Alaska | 10 | 0.07% | Low / Severe Spatial Dispersion |
| Wyoming | 8 | 0.05% | Low / Sovereign Energy Reserve Base |
| National Total | 15,000 | 100.00% | Systemic National Economic Impairment |
(The Bitter Truth): Behind the raw numbers lies a fiscal black hole. The top 10 states shoulder 6,150 incidents, or 41% of total domestic carnage. This drains their most lucrative metropolitan zones, shifts local tax revenues into unrecoverable emergency medical services, and saddles taxpayers with escalating public liabilities.
The “So What?” Factor: The Direct Economic Domino Effect
Macroeconomic models frequently discard violent crime as a peripheral externality, categorizing it under sociological reviews. That is a critical flaw.
Every single bullet fired creates a ripple effect throughout the broader economy:
1. Human Capital Liquidation (The Lifetime Earnings Void)
The median age of a gun violence victim in the United States sits squarely between 18 and 34 years old. This cohort constitutes the prime demographic for long-term labor productivity, technical specialization, and domestic consumption.
When a 24-year-old skilled worker or service-sector producer is killed or permanently disabled, the immediate financial calculation is brutal:
-
You extinguish between 35 and 45 years of net-positive economic output.
-
At a conservative annual productivity value of $65,000, adjusted for modest wage gains, the direct baseline loss reaches $2.5 Million to $3.5 Million per casualty in discounted lifetime economic output.
-
This wipes out their lifetime contributions to federal income taxes, state sales taxes, local property taxes, and their share of payroll taxes for Social Security and Medicare.
-
When scaled across 15,000 incidents accounting for fatal outcomes, acute long-term trauma, and permanent cognitive or physical disability the direct loss of human capital from the 2025 cohort alone siphons away more than $38 Billion in future productivity.
2. The Uncompensated Emergency Trauma Subsidy
Private healthcare providers do not absorb surgical and critical-care costs for penetrating ballistic wounds; the public balance sheet does. The National Institute for Health Care Management points out that over 70% of immediate physical trauma care costs from gunshot wounds are footed by Medicaid and uncompensated public hospital contingency funds.
A single complex gunshot resuscitation requires extensive trauma team deployment, intensive care bed utilization, multiple exploratory laparotomies, and long rehabilitative stays. This quickly rings up between $150,000 and $1.2 Million per patient.
Who pays? The local tax base. Every dollar consumed by this triage is a dollar stolen from municipal infrastructure maintenance, power-grid modernization, and public education.
3. Commercial Real Estate Devaluation and the “Dead-Zone” Premium
Capital does not stick around in neighborhoods scarred by repeated violent crime. Look at the commercial corridors of South and West Chicago (Illinois, 650 incidents), North Philadelphia (Pennsylvania, 550 incidents), East Cleveland (Ohio, 500 incidents), or parts of Houston and Dallas (Texas, 1,100 incidents).
The pattern repeats itself:
-
High-incident zones experience immediate property tax assessment drops ranging from 18% to 35%.
-
National retail chains, grocery distribution centers, and corporate logistics hubs pull out entirely to eliminate inventory shrink and safeguard staff.
-
Landlords mark down commercial leases, attracting lower-tier commercial activity and leaving properties vacant.
-
The city then raises commercial property taxes on safe zones to offset losses from blighted areas, driving businesses straight into exurban zones or competing states.
Global Anchoring: The Tier-1 and Tier-2 Competitive Disadvantage
An economy does not exist in a vacuum. It competes on sovereign stability, operational costs, and the predictability of its legal and physical environment. Compare the American balance sheet to its international peers.
The Tier-1 League: Germany, Japan, United Kingdom, and Australia
In Japan and the United Kingdom, gun violence rates remain negligible, while in Germany and Australia, tightly controlled licensing and systematic enforcement limit incidents to isolated statistical outliers.
What does this mean for economic productivity?
-
Zero Security Tax on Foreign Direct Investment (FDI): When a global chip manufacturer, logistics operator, or corporate headquarters sets up shop in Munich, Yokohama, or Sydney, corporate security costs rarely top 0.1% of operating expenses.
-
Public Infrastructure Integration: Public transport nodes, light rail systems, and downtown pedestrian hubs in these nations operate safely late into the evening. This creates a dense, integrated night-time service economy with high asset utilization.
-
Intact Municipal Balance Sheets: Tier-1 sovereign peers do not burden their healthcare systems with uncompensated ballistic trauma, freeing up resources to fund workforce retraining, engineering subsidies, and public research.
The United States Paradigm: Developed Riches with Developing-Nation Risk
The United States presents a rare paradox: a reserve-currency nation with deep capital markets, functioning under the physical security vulnerabilities of a Tier-2 emerging market. The sheer volume of 15,000 incidents puts the US closer to Brazil, Mexico, and South Africa in physical trauma liabilities than to Germany, Japan, or Australia.
This structural divergence acts as a stealth corporate surcharge:
-
The Corporate Security Tax: American businesses sink an estimated $45 Billion to $60 Billion annually into private armed security details, bullet-resistant architectural retrofits, access-control software, and mass-shooter liability insurance. This capital is defensive and unproductive it adds zero real economic output.
-
Labor Mobility Friction: High-value corporate talent increasingly rejects assignments in urban areas with high violent crime rates. This forces companies to pay an urban-risk compensation premium, decentralize operations, or absorb the cost of redundant suburban offices.
Seasonality and Anomaly Alert: Short-Term Noise vs. The Structural Trend
Do not let election-year pundits deceive you with short-term narratives. A temporary dip in year-over-year incident tallies is routinely spun by political operatives as proof that a pet initiative is working. That is statistical noise. The reality is an intractable, structural baseline.
-
The Temperature and Seasonal Delta: Incident counts climb consistently every year between May and September, tracking higher temperatures, extended daylight hours, and the release of school-age cohorts into unsupervised urban environments. A 15% to 22% seasonal bump during summer months is common and should not be mistaken for a permanent breakdown in law enforcement.
-
The Post-2020 Equilibrium: The jump in violent crime during the 2020–2022 pandemic cycle was dismissed by many economists as an anomaly driven by lockdowns, shuttered schools, and frayed social safety nets. That was wishful thinking. The drop from peak pandemic highs has leveled off at an elevated baseline. The 15,000 cases in 2025 prove that the baseline has permanently reset above pre-2019 levels.
-
Firearm Capitalization Density: The sustained baseline is reinforced by record civilian gun acquisitions over the past decade. Over 130 Million firearms entered domestic circulation via FBI NICS background checks between 2019 and 2025. The secondary and untracked black-market firearm pools have grown right alongside legal sales. This saturation guarantees high incident volumes for years to come, regardless of routine economic upturns or downturns.
The Core Breakdown: Two-Sided Economic Risk Assessment
A responsible financial strategist must evaluate this landscape from both sides of the balance sheet. What does this perpetual crisis mean for businesses and institutional capital?
1. The Bear Case: Capital Flight, Municipal Insolvency, and Labor Erosion
The Bear Case points to sustained capital erosion that threatens the creditworthiness of major American municipal and regional issuers.
-
Municipal Credit Downgrades: Cities like Chicago (Illinois), Memphis (Tennessee), St. Louis (Missouri), and Philadelphia (Pennsylvania) face rising public safety expenditures alongside declining tax revenues. When bond-rating agencies inevitably dock municipal credit ratings, infrastructure borrowing costs jump. This triggers austerity measures, cuts to essential public services, and sets off fresh rounds of outmigration.
-
The High-Income Taxpayer Revolt: Wealthy households vote with their feet. The flight from high-tax, high-incident states like California (1,250 cases) and Illinois (650 cases) toward lower-tax states like Texas (1,100 cases) and Florida (850 cases) was historically pitched as a search for lower taxes. However, as Texas and Florida see violent crime counts rise alongside rapid population growth, capital runs out of safe havens. It retreats into high-cost, gated suburban communities, cutting off revenue from urban municipal coffers.
-
Insurance Market Contraction: Casualty and business-interruption insurance lines are pricing in elevated firearm incident rates. In high-density commercial strips, small and medium enterprises (SMEs) face steep insurance rate hikes or outright policy cancellations for active-assailant and public-liability coverage. This drives local business bankruptcies, leaving vacant storefronts and blighted commercial avenues in their wake.
2. The Bull Case: The “Fortress Economy” and Defensive Capital Capture
Capital never truly dies; it shifts, hedges, and capitalizes on defensive growth channels.
-
The Boom in Homeland Security and Defense Equities: The domestic security industry is one of the fastest-growing defensive sectors in the American market. Billions in venture capital and private equity flow into:
-
Autonomous visual and acoustic surveillance platforms (e.g., ShotSpotter, automated drone patrols).
-
AI-powered weapon-detection screening arrays for public schools, sports venues, and corporate real estate.
-
Architectural retrofits, perimeter access-control technologies, and blast-mitigation building materials.
-
-
Suburban Corporate Campuses and Satellite Urban Centers: The erosion of traditional downtown districts has fueled massive commercial development across master-planned suburban centers. High-incident counts in primary cities accelerate investments in secure satellite hubs, such as the northern sprawl of Dallas-Fort Worth, coastal retreats, and gated business parks in Utah (110 cases) and Idaho (70 cases). Developers in these safe pockets command substantial rent premiums.
-
Healthcare Trauma Specialization: American academic medical centers have transformed into premier trauma and critical-care research hubs. The treatment protocols, specialized surgical implants, and acute wound-care technologies refined in urban trauma wards are finding lucrative export markets across the globe.
The Alternative Scenario: What If Federal Policy Fractures or Freezes?
Consider an unexpected pivot: what happens to the economy if the policy baseline shifts overnight?
Scenario A: Total Judicial Deregulation (The Bruen Trajectory Accelerated)
If the United States Supreme Court expands Second Amendment protections to strike down all state-level restrictions on concealed carry, assault-style platforms, and magazine capacities:
-
Blue states like California and New York would see their remaining regulatory defenses dismantled.
-
Corporate boardrooms, tech campuses, and universities would lose the ability to establish gun-free zones without running into complex civil-rights challenges.
-
Corporate legal and insurance costs would surge. Global firms would re-evaluate capital investments in US metros, accelerating a move toward remote work and distributed footprints to protect employees.
Scenario B: The Extreme Federal Push (The Commerce Clause Crackdown)
Conversely, suppose a future federal administration uses its authority to bypass Congress, levying an unbacked 200% federal excise tax on ammunition, pushing through microstamping mandates, and stripping away manufacturer liability protections:
-
An immediate run on supply would sweep the nation. A massive underground, cash-only market would emerge, enriching transnational smuggling cartels operating through the southern border.
-
The economic fallout would shift from public healthcare subsidies to sprawling law-enforcement expenditures, asset forfeitures, and costly criminal litigation.
-
Gun companies would face bankruptcies, triggering defaults on municipal industrial revenue bonds across the rural communities where their manufacturing plants are based.
The Vision: Comparative Forecast (2026 – 2030 – 2047)
The trajectory of this economic bleed can be projected through three milestones. Here is where the American macroeconomic balance sheet stands relative to global competitors over the next two decades:
1. By 2030 (The Mid-Term Horizon)
Within the next four years, the division between high-violence and low-violence areas will widen into sharp geographic inequality.
-
Metros that fail to stem community violence will see their downtown office cores hollow out, turning into commercial “doughnuts” where prosperous suburbs ring a hollow, distressed center.
-
Yield spreads on municipal general obligation (GO) bonds will widen dramatically. Cities like Chicago, St. Louis, and Baltimore will be forced to pay a persistent 75 to 150 basis-point penalty over baseline benchmark indices just to entice institutional capital to finance basic infrastructure projects.
2. By 2047 (The Century Pivot: India’s Rise vs. The Western Bleed)
As India approaches its Centenary of Independence (Viksit Bharat 2047), the macro landscape will contrast sharply.
-
India’s Demographic Dividend Unleashed: Projecting an economy that could top $25 Trillion to $30 Trillion, India’s growth is built on digital infrastructure, industrial manufacturing, and an immense, young workforce. Critically, this young demographic is virtually unburdened by civilian ballistics trauma or domestic gun violence.
-
The American Structural Anchor: By 2047, the compounding cost of managing generations of gun violence spanning uncompensated medical debt, lifetime productivity losses, private security operations, and fortified infrastructure could saddle the US with a permanent 1.5% to 2.0% drag on its gross economic potential.
-
Capital flows will adjust to this reality. Sovereign wealth funds, international conglomerates, and private equity allocators will direct capital toward markets that combine high demographic yields with basic public safety, avoiding regions that saddle business with a persistent violence surcharge.
My Verdict: The Cold Economic Reality
Gun violence in the United States is rarely examined for what it actually is: an uncontrolled sovereign economic liability.
Morality campaigns and political debates have failed for half a century because they frame the issue as an ideological tug-of-war. Ideology is cheap. Ideology does not need to balance a budget, service general obligation debt, or keep an urban trauma center solvent through the third quarter.
The 2025 data shows 15,000 incidents across state lines, demonstrating that this crisis is a systemic, multi-billion-dollar drain that damages American competitiveness on the world stage.
If the United States continues to treat the erosion of its human and commercial capital as an acceptable cost of domestic culture wars, it will eventually pay the price in economic leadership. You cannot lead the world in artificial intelligence, advanced aerospace, and quantum computing when your prime-age workforce is dodging bullets in high-density commercial centers, and your cities are shifting infrastructure funds to patch up gunshot wounds in emergency rooms.
To institutional allocators, business owners, and corporate leaders: stop relying on empty political promises. Factor a permanent violence risk-premium into your long-term capital models. Adjust your real-estate portfolios. Modernize your physical and financial operations, and prepare for a future where personal safety and sovereign stability are the ultimate investment assets.
GOOGLE ‘PEOPLE ALSO ASK’ FAQs
Q1: What is the total macroeconomic cost of gun violence in the US?
A: Over $38 Billion in future labor output was erased by 2025’s 15,000 incidents alone. Total systemic impacts divert $45–$60 Billion annually into defensive security, draining roughly 0.8% of US gross domestic product.
Q2: Which US states face the highest economic risk from gun violence?
A: California and Texas lead exposure, generating 1,250 and 1,100 incidents respectively to claim 15.6% of the national total. Combined with Florida and Illinois, these economic engines absorb the heaviest commercial real estate write-downs and municipal bond penalties.
Q3: How does gun violence directly devalue commercial real estate?
A: Commercial corridors in high-incident zones suffer property assessment drops of 18% to 35%. National retail chains exit blighted urban centers to avoid inventory shrink, creating vacant commercial deserts and eroding core municipal tax revenue.
Q4: Who pays for the emergency healthcare costs of gunshot wounds?
A: Over 70% of acute physical trauma costs are funded by Medicaid and uncompensated municipal hospital balances. A single ballistic resuscitation costs between $150,000 and $1.2 Million, shifting immediate private casualties directly onto local taxpayers.
Q5: How will gun violence affect global economic competition by 2047?
A: By 2047, the compounding fiscal drag will impose a permanent 1.5% to 2.0% penalty on US gross output potential. Conversely, expanding economies like India maintain a structural advantage, deploying young human capital unburdened by chronic ballistic trauma subsidies.
Data Source:
- National Institute for Health Care Management (NIHCM)
- FBI NICS Database
- US State Public Health Registries
Disclaimer: This report is for informational and analytical purposes only and does not constitute formal financial, investment, or policy advice.