The Great Sub-National Wealth Migration: How Internal Tax Fractures Are Cannibalizing Legacy Economies and Reshaping Global Capital
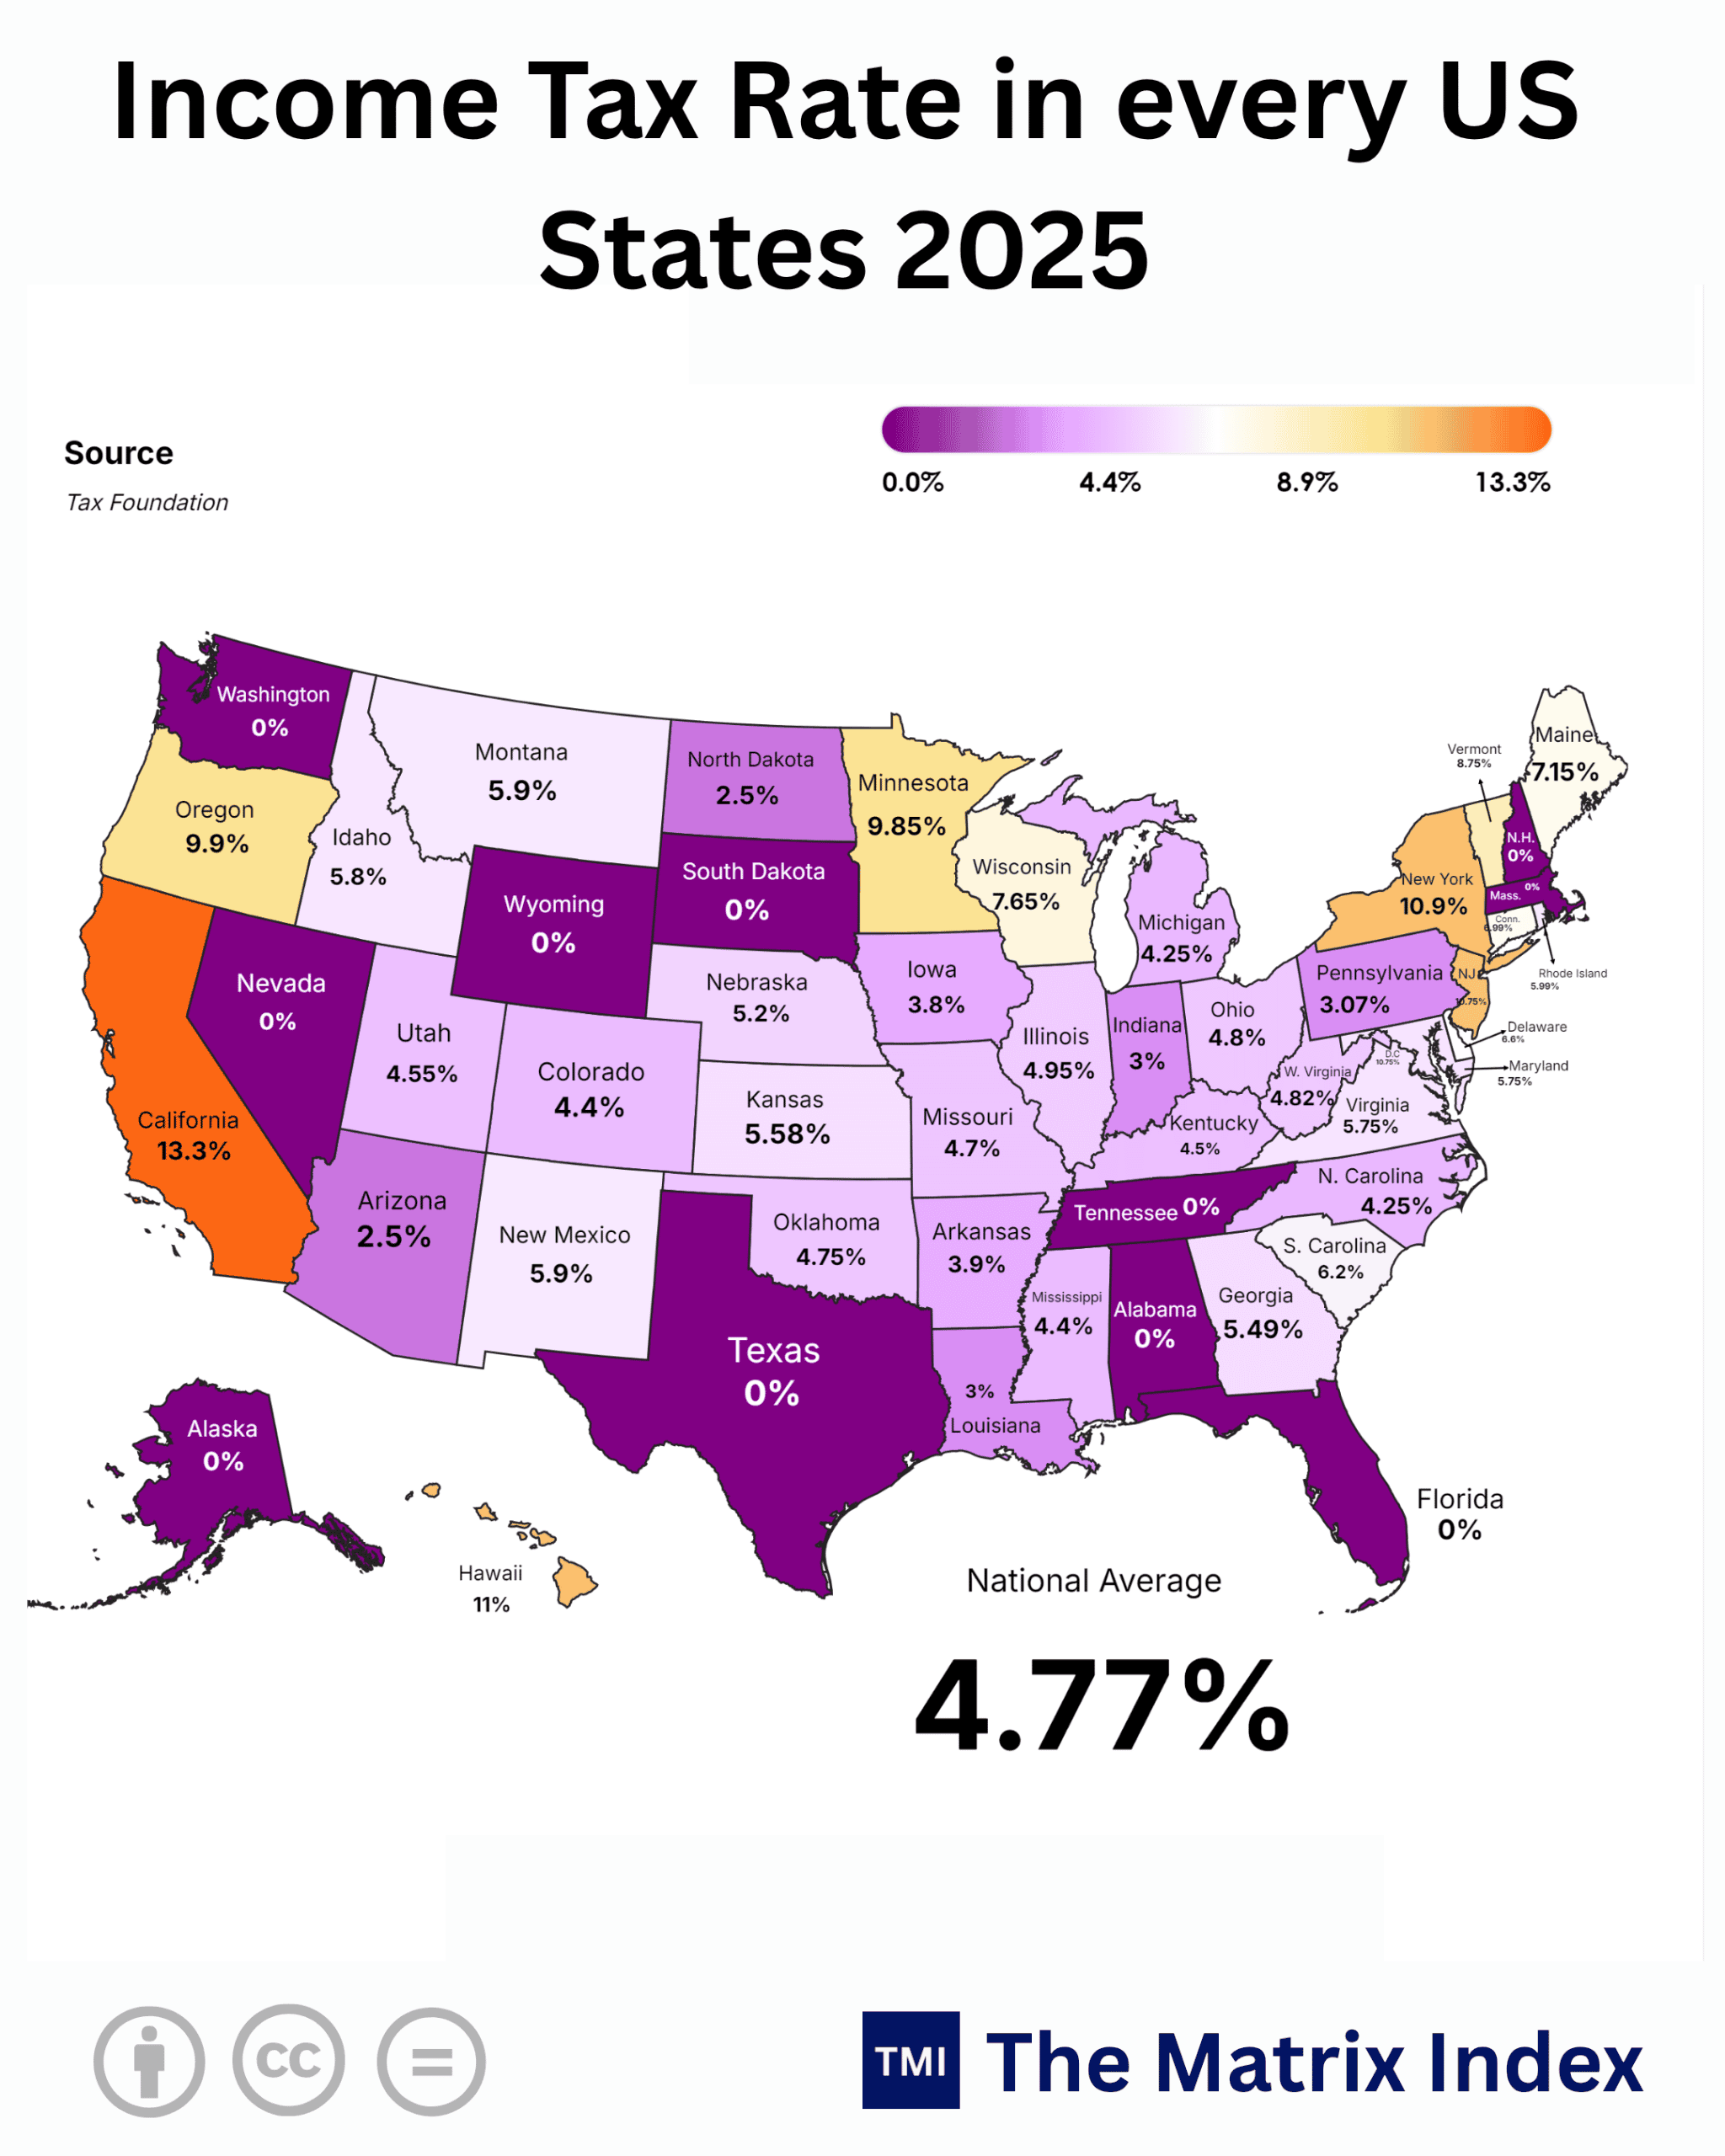
| State | Income Tax Rate (2025) |
|---|---|
| California |
13.3% |
| New York |
10.9% |
| Oregon |
9.9% |
| Minnesota |
9.85% |
| Wisconsin |
7.65% |
| Maine |
7.15% |
| New Jersey |
6.53% |
| S. Carolina |
6.2% |
| Montana |
5.9% |
| New Mexico |
5.9% |
| Idaho |
5.8% |
| Virginia |
5.75% |
| Maryland |
5.75% |
| Kansas |
5.58% |
| Georgia |
5.49% |
| Nebraska |
5.2% |
| Ohio |
4.8% |
| Missouri |
4.7% |
| Oklahoma |
4.75% |
| Kentucky |
4.5 |
| Utah |
4.55% |
| Mississippi |
4.4% |
| Colorado |
4.4% |
| N. Carolina |
4.25% |
| Iowa |
3.8% |
| Arkansas |
3.9% |
| Indiana |
3.0% |
| Louisiana |
3.0% |
| Pennsylvania |
3.07% |
| W. Virginia |
4.82 |
| North Dakota |
2.5% |
| Arizona |
2.5% |
| Washington |
0% |
| Nevada |
0% |
| Wyoming |
0% |
| South Dakota |
0% |
| Texas |
0% |
| Tennessee |
0% |
| Alabama |
0% |
| Florida |
0% |
| Alaska |
0% |
| N.H. (New Hampshire) |
0% |
| Mass. (Massachusetts) |
5.0% |
| Connecticut |
6.99% |
| Delaware |
6.6% |
| Rhode Island |
5.99% |
| Vermont |
8.75% |
| Hawaii |
11% |
| National Average |
4.77% |
NEW DELHI, India (October 25, 2026 / IST) — High-tax jurisdictions are bleeding productive capital, and the bureaucratic architects running them are operating in terminal denial. For three decades, the consensus among orthodox public finance theorists was simple: agglomeration economies, cultural prestige, and legacy institutional inertia would always trump marginal tax rates. That doctrine is dead.
When an individual or enterprise can move a server rack, a headquarters, or an investment portfolio with a few digital signatures, taxing income at double-digit marginal rates ceases to be civic revenue collection. It becomes systematic economic eviction.
The baseline dataset for state income taxes reveals an existential divergence within the world’s largest economy. A spread spanning from an confiscatory 13.3% in California down to absolute zero in competitive juggernauts like Texas, Florida, and Washington is tearing open geographic fractures.
This is not a temporary statistical aberration. It is a calculated, permanent capital flight.
Look across the Pacific at emerging markets like India, racing toward its Vision 2047 centenary milestone of becoming a developed superpower, or across Europe where wealth migration is stripping sovereign treasuries bare. The lesson is screamingly obvious: jurisdictions that treat capital creators as captive balance sheets will eventually find themselves managing hollowed-out monuments of their former prosperity.
The Sovereign Illusion: Why Sub-National Arbitrage is Cannibalizing Legacy Hegemons
Governments consistently confuse sovereign necessity with regional monopoly power. If the federal sovereign taxes an asset, leaving requires surrendering a passport, paying expatriation exit taxes, and navigating the global labyrinth of FATCA. But inside a federation, the internal borders are frictionless.
The baseline national average for state income tax sits at 4.77%. Yet the dispersion around that mean is absurd.
At the predatory extreme, we find:
-
California at 13.3%
-
Hawaii at 11.0%
-
New York at 10.9%
-
Oregon at 9.9%
-
Minnesota at 9.85%
At the opposite pole sits the Zero-Tax Coalition: Texas, Florida, Tennessee, Nevada, Wyoming, South Dakota, Washington, and Alaska sitting at 0%.
When a founder, an executive, or a quantitative hedge fund team works in Manhattan or San Francisco, their combined marginal tax rate stacking federal, state, and city taxes alongside payroll levies comfortably surpasses 53%. More than half of every marginal dollar earned goes directly to subsidize institutional overhead, legacy public pensions, and municipal decay.
“A bird in hand is worth two in the bush,” the old English proverb goes. But policymakers in Sacramento and Albany have inverted the wisdom: they strangle the golden goose currently laying eggs in their hand, convinced it has nowhere else to fly.
It does. Capital does not march to ideological drums; it flows silently along paths of least resistance.
Historically, this predatory extraction was excused by the “agglomeration premium.” You stayed in the San Francisco Bay Area because that was where Sand Hill Road venture capitalists had lunch. You stayed in New York because institutional trading desks, prime brokerages, and corporate boards were physically tethered to Midtown.
That physical tether has snapped permanently.
Between 2020 and 2026, the physical centralization of knowledge work completely dismantled itself. When the institutional ecosystem went cloud-native, the multi-million-dollar tax bill stopped buying elite network access. Instead, it bought crumbling transit systems, visible civic decline, and ballooning state deficits.
Sub-national tax arbitrage is not a trivial line-item optimization. It is an evolutionary stress test that legacy states are spectacularly failing.
Anatomy of the Sub-National Ledger: The Competitive Stratification
To understand the scale of this structural fracture, analyze the tax architectures across the American landscape. The states fall into five distinct fiscal profiles:
Global Parallels: How the US Divide Mirrors the World Stage
This domestic dynamic in the United States does not exist in an economic vacuum. It directly mirrors the seismic capital shifts taking place across the global theater.
Take Europe. The United Kingdom made the catastrophic strategic error of dismantling its long-standing “Non-Dom” tax regime while aggressively increasing its tax burden toward generational highs.
The result? Predictable, unmitigated economic self-sabotage.
High-net-worth individuals, tech founders, and sovereign wealth conduits did not quietly surrender 45% to 50% of their global earnings to HM Revenue & Customs. Instead, billions in mobile liquidity packed its bags and landed in Dubai (UAE), Milan (Italy) with its flat €100,000 foreign income substitute tax, and Switzerland.
London’s luxury property market froze, while Dubai’s real estate transactions broke all historical records.
Look at Germany, where crushing industrial energy tariffs collided with punishing corporate income tax rates of 30% (when factoring in municipal trade taxes). Industrial titans like BASF and Volkswagen began gutting domestic outlays to redirect their capital expenditure engines to the United States and China.
Now contrast this with India.
Under its transformative corporate tax reset, New Delhi boldly slashed base corporate tax rates for new domestic manufacturing units down to an ultra-competitive 15%, alongside a rationalized baseline corporate rate of 22%.
Simultaneously, India deployed its flagship Production Linked Incentive (PLI) schemes, throwing open the doors to global supply chain titans like Apple, Foxconn, and Micron.
While Western welfare regimes exhaust their energy dreaming up wealth taxes, exit fees, and punitive administrative hurdles, the Indian economic engine is busy playing offensive chess:
By laying thousands of kilometers of industrial freight corridors, setting up GIFT City as an international, low-friction financial hub, and consolidating indirect taxes through the unified GST framework, India is actively building an environment designed to attract, compound, and retain generational capital.
The world order is undergoing a massive, foundational realignment:
-
Extractive Economies (such as the UK, California, and France) rely on past prestige to justify present confiscation.
-
Aggressive Builder Economies (such as Texas, Florida, the UAE, and India) treat regulatory clarity, minimal compliance drag, and tax efficiency as indispensable strategic weapons.
The “So What?” Factor: The Brutal Ripple Effect on Main Street
What does a spreadsheet comparing state tax rates mean for the plumber in Sacramento, the retail worker in Cleveland, or the software engineer in Bengaluru?
Everything.
Public finance does not operate in an abstract sandbox. When a high-earning bracket relocates, the fiscal fallout does not harm the ultra-wealthy individuals who left. It devastates the ordinary working families left behind.
In California, the top 1% of earners contribute nearly 50% of the state’s entire personal income tax revenue.
Ponder that concentration of risk for a moment. When a few dozen venture capital executives, hedge fund partners, and high-profile tech founders pack up their estates in Palo Alto or Malibu and buy ranches in Austin or Miami, the state budget instantly suffers a structural heart attack.
Capital flight immediately triggers a vicious downward fiscal cycle:
To cover the multi-billion-dollar holes blown into their annual balance sheets, legacy states cannot immediately slash entrenched public union contracts or bloated administrative budgets.
So what do they do? They go after captive populations.
They hike sales taxes. They let fuel excise taxes soar past $0.50 to $0.60 a gallon. They reassess property values to squeeze homeowners, and they tack on endless municipal junk fees.
The blue-collar worker who never earned enough to care about the top 13.3% tax bracket suddenly finds their daily cost of living completely unbearable.
At the same time, look at what happens in the receiving zero-tax corridors. In cities like Dallas, Fort Worth, Orlando, and Nashville, incoming capital creates a hyper-accelerated private investment boom.
Warehouses, advanced manufacturing hubs, datacenters, and entertainment complexes break ground overnight. High-paying jobs multiply across logistics, specialized legal services, construction, and healthcare.
Yet, this sudden influx brings its own sharp growing pains:
-
Runaway housing costs squeeze long-time local residents out of starter homes.
-
Highway networks choke under rapid population surges.
-
Power grids and municipal water systems face severe strain.
Unmanaged capital flight destabilizes the host that abandons it, while delivering a massive, double-edged shockwave to the boomtowns absorbing it.
Seasonality and Anomaly Alert: Structural Flight vs. Cyclical Noise
Wall Street pundits and government economists often try to dismiss these massive wealth shifts as “pandemic anomalies” or “cyclical real estate fads.”
They are dead wrong.
We must make a clean distinction between temporary, cyclical noise and permanent, structural transformations:
A cyclical fluctuation is a junior tech worker leaving Manhattan for Miami during an economic freeze, only to return two years later when venture-backed hiring sprees pick up again.
A structural transformation, on the other hand, is Caterpillar pulling its global headquarters out of Illinois to plant permanent roots in Texas. It is Citadel shifting its core market-making engines from Chicago to Miami. It is Charles Schwab abandoning San Francisco for the Dallas-Fort Worth metroplex.
These corporate relocations demand hundreds of millions of dollars in fixed investments, complex legal reorganizations, and long-term commitments to corporate governance frameworks.
Once a corporation breaks ground on a corporate campus in North Carolina, or an executive permanently moves their multi-generational family office to Nevada, they are not coming back.
The data confirms this: the capital flight out of the Northeast and the West Coast is accelerating through fixed-capital investments, corporate charter revisions, and the strategic positioning of advanced manufacturing infrastructure.
The Strategic Balance Sheet: The Bull vs. Bear Case
To build a rigorous economic outlook, we must abandon ideological bias and dissect the hard data on both sides.
The Bull Case for Low-Tax Corridors
-
Unprecedented Capital Compounding: Zero and low-tax states allow private enterprises and key talent to retain a significantly higher share of their operational cash flows. This capital is immediately reinvested into research and development, operational hiring, and manufacturing automation rather than disappearing into bureaucratic black holes.
-
Defensive De-Risking for Corporations: In an era of intense deglobalization, geopolitical friction, and higher interest rates, companies cannot afford to carry operational deadweight. Migrating to states like Texas, Tennessee, or North Carolina significantly lowers overhead, keeps warehouse footprints affordable, and insulates corporate earnings from sudden state-level tax grabs.
-
Domestic Supply Chain Independence: The aggressive influx of industrial capital into the Sunbelt and the American Southeast is driving an unprecedented wave of reshoring. From massive semiconductor fabrication plants in Phoenix to electric vehicle and battery manufacturing hubs across Georgia, lower-tax states are systematically building the domestic industrial base of the next century.
The Bear Case and Hidden Structural Pitfalls
-
The Illusion of Low Taxes (Regressive Cost-Shifting): There is no such thing as a truly free lunch in public finance. A state that refuses to tax personal income must balance its books somewhere else. Texas hits its residents with some of the highest, most aggressive effective property tax rates in the nation, routinely exceeding 1.6% to 2.2% of a home’s market value. If property values double during an economic boom, a retiree or a working-class family can easily face an unexpected property tax bill of $12,000 to $18,000 a year, driving them into financial distress.
-
Severe Infrastructure and Resource Bottlenecks: Growth comes at a steep price. The rapid migration of industrial scale into regions lacking modernized infrastructure has brought severe challenges:
-
The fragile Texas electric grid (ERCOT) faces extreme vulnerability during severe winter freezes and summer heatwaves.
-
Rapidly expanding desert tech hubs like Arizona face looming water allocation cuts along the Colorado River basin.
-
Public school systems and municipal transit networks in underfunded rural counties are buckling under rapid population growth.
-
-
Cultural Resistance and Talent Pushback: As non-economic, socially restrictive state policies take center stage in several deep-red, zero-tax corridors, top-tier global talent particularly elite software engineers, specialized biomedical researchers, and executive-track women is showing visible resistance to permanent relocation. If a corporate campus cannot recruit the top 5% of global minds, its initial tax savings are quickly erased by competitive stagnation.
The Alternative Scenario: The Counter-Strike of the Legacy Hegemons
What happens if the current rules of the game change overnight? To assume legacy states will sit by passively while their tax bases walk out the door is dangerous naivety.
Economic history proves that when an extractive power faces financial ruin, it rarely embraces disciplined fiscal austerity. Instead, it builds legal walls to trap the assets inside.
1. The Federal Wealth Grab Strategy
Watch for high-tax states to aggressively lobby federal lawmakers for uniform, national-level minimum wealth taxes, aggressive capital gains surcharges, or mandatory revenue-sharing compacts.
If Sacramento and Albany can leverage their political influence in Washington D.C. to pass federal mandates that level the playing field, they can effectively nullify the competitive advantage enjoyed by states like Florida and Texas.
2. The Trapdoor: Aggressive Exit Taxes and Residency Audits
We are already seeing the opening salvos of this counter-attack. California has repeatedly introduced legislative proposals for retroactive wealth taxes and multi-year trailing taxes on wealth created within its borders even long after an individual has established legal domicile in another state.
Tax compliance audits in New York and California are turning into forensic witch-hunts. State tax authorities are pulling mobile phone location metadata, credit card swipe timestamps, smart-thermostat logs, and private aviation flight manifests to dispute relocations and extract back-taxes from departures.
3. The Digital Extraction Model
If an enterprise moves its executive suite to Austin but continues to serve customers, process payments, and store data in the consumer markets of the Northeast and the West Coast, expect legacy states to retaliate with aggressive gross receipts taxes, digital service transaction levies, and data transit fees.
The future will not be a peaceful, orderly migration. It will be an aggressive legal and regulatory war between dying geographic monopolies and the mobile capital breaking free from their grip.
Strategic Blueprint: The 2026 Sovereign and Institutional Scorecard
The Verdict: Economic Realities and the Vision for 2030–2047
Look past the political posturing and analyze the hard balance sheets: the world has entered an era of structural financial repression. Western sovereign debts have crossed all sustainable historical thresholds, with the United States national debt surpassing $35 Trillion and climbing at an unsustainable run-rate.
In a global macroeconomic environment defined by structural inflation, expensive energy transitions, and higher baseline interest rates, capital efficiency is not a luxury. It is a fundamental condition for survival.
The Immediate Horizon: 2026 to 2030
Over the next four years, the high-tax, progressive fiscal model will run headfirst into a demographic and balance-sheet brick wall.
States like California, New York, and Illinois will face widening structural deficits as their highest-tier earners finish relocating. They will respond predictably: with panicked tax hikes, new asset surcharges, and aggressive legal battles over trailing exit fees.
In sharp contrast, the domestic zero-tax corridors will be forced to grow up fast. They must quickly fix their critical infrastructure bottlenecks reinforcing power grids, addressing regional water scarcity, and modernizing transportation corridors or risk having their economic growth choked off by the sheer weight of incoming capital.
The Long Arc: The Road to 2047
Zoom out to the mid-century horizon, where India is charting its course toward Vision 2047 its ambition to emerge as an unshakeable, multi-trillion-dollar global economic powerhouse.
The clear lesson for developing superpowers is to avoid the seductive, terminal traps of the Western welfare state:
-
Do not build bloated, un-fundable administrative regimes that consume productive output.
-
Do not view high-earning innovators, ambitious founders, and private enterprise as captive assets to be harvested.
-
Treat capital formation as a fragile, precious national advantage that demands protection, stable rules, and low frictional costs.
If India keeps its corporate tax structures competitive, relentlessly cuts logistics costs down toward 8% of GDP, deepens GIFT City’s financial ecosystem, and resists the siren song of punitive, progressive wealth taxation, it will continue to pull massive waves of global manufacturing, industrial supply chains, and private capital into its borders.
The future belongs unequivocally to the builders, the pragmatists, and the low-friction economies.
The old world is clinging to past glories, hoping nostalgia can balance its books. The new world is building transparent, competitive, and frictionless homes for the capital that shapes our future.
Choose where you anchor your business, deploy your capital, and build your wealth with ruthless, clear-eyed realism. The economic map is being permanently redrawn right in front of us and the ledger has no room for sentimentality.
Where is your capital anchored today, and is your business properly insulated to withstand the aggressive fiscal counter-measures emerging across both domestic and international tax jurisdictions?
GOOGLE ‘PEOPLE ALSO ASK’ FAQs
Q1: Which US states have the highest and lowest state income tax rates?
California leads with a 13.3% top individual rate, followed by Hawaii at 11% and New York at 10.9%. Conversely, eight states maintain a 0% rate, including Texas, Florida, Nevada, and Tennessee.
Q2: What is the US national average state income tax rate?
The national average rate stands at 4.77% across all reporting jurisdictions. This benchmark highlights the sharp divergence between double-digit extractive states and zero-tax economic corridors.
Q3: How does state tax flight impact middle-class residents who remain?
A 1% bracket exit can wipe out nearly 50% of an extractive state’s income tax receipts. Left behind, middle-class households absorb the shortfall through higher sales taxes, utility fees, and real estate reassessments.
Q4: Do zero-income-tax states have hidden tax burdens?
Texas offsets its 0% rate with effective property taxes between 1.6% and 2.2%, costing homeowners upwards of $12,000 annually. Other no-income-tax states rely heavily on elevated consumer sales taxes and commercial gross receipts levies.
Q5: How will sub-national tax competition affect global economies by 2047?
By 2047, mobile global capital will entirely bypass jurisdictions imposing marginal rates above 40%. Developing hubs like India with 15% manufacturing baselines and zero-tax jurisdictions will capture the vast majority of fixed industrial investments.
Data Source:
- Tax Foundation
- US Census Bureau
- Bureau of Economic Analysis
- Ministry of Finance (India)
- OECD Tax Database
Disclaimer: This report is for informational and analytical purposes only and does not constitute formal financial, investment, or policy advice.